Problem and decision
ProblemArchitecture documents are usually diagrams and opinions. The decisions in them are rarely tied to evidence, and the evidence, when it exists, lives in a different place from the decision and drifts away from it.
DecisionWrite the platform as decision records whose evidence is generated from one file of measured results, so a figure cannot change in one place and not the other; state which decisions are measured and which are modelled; and price the platform choice from list prices with every source quoted.
Scope
- Team
- One person
- Scale
- 13 decision records, 32 measured figures from nine public repositories, quality targets, governance, operations runbooks, and a cost model across six engine options and three workload tiers
- Links
- Source
Outcomes
- 12 of 13 platform decisions backed by results measured in public labs each decision record cites figures from evidence/evidence.yml, generated into the record by scripts/build.py; CI fails if a figure drifts or a source link breaks · Oct 2026
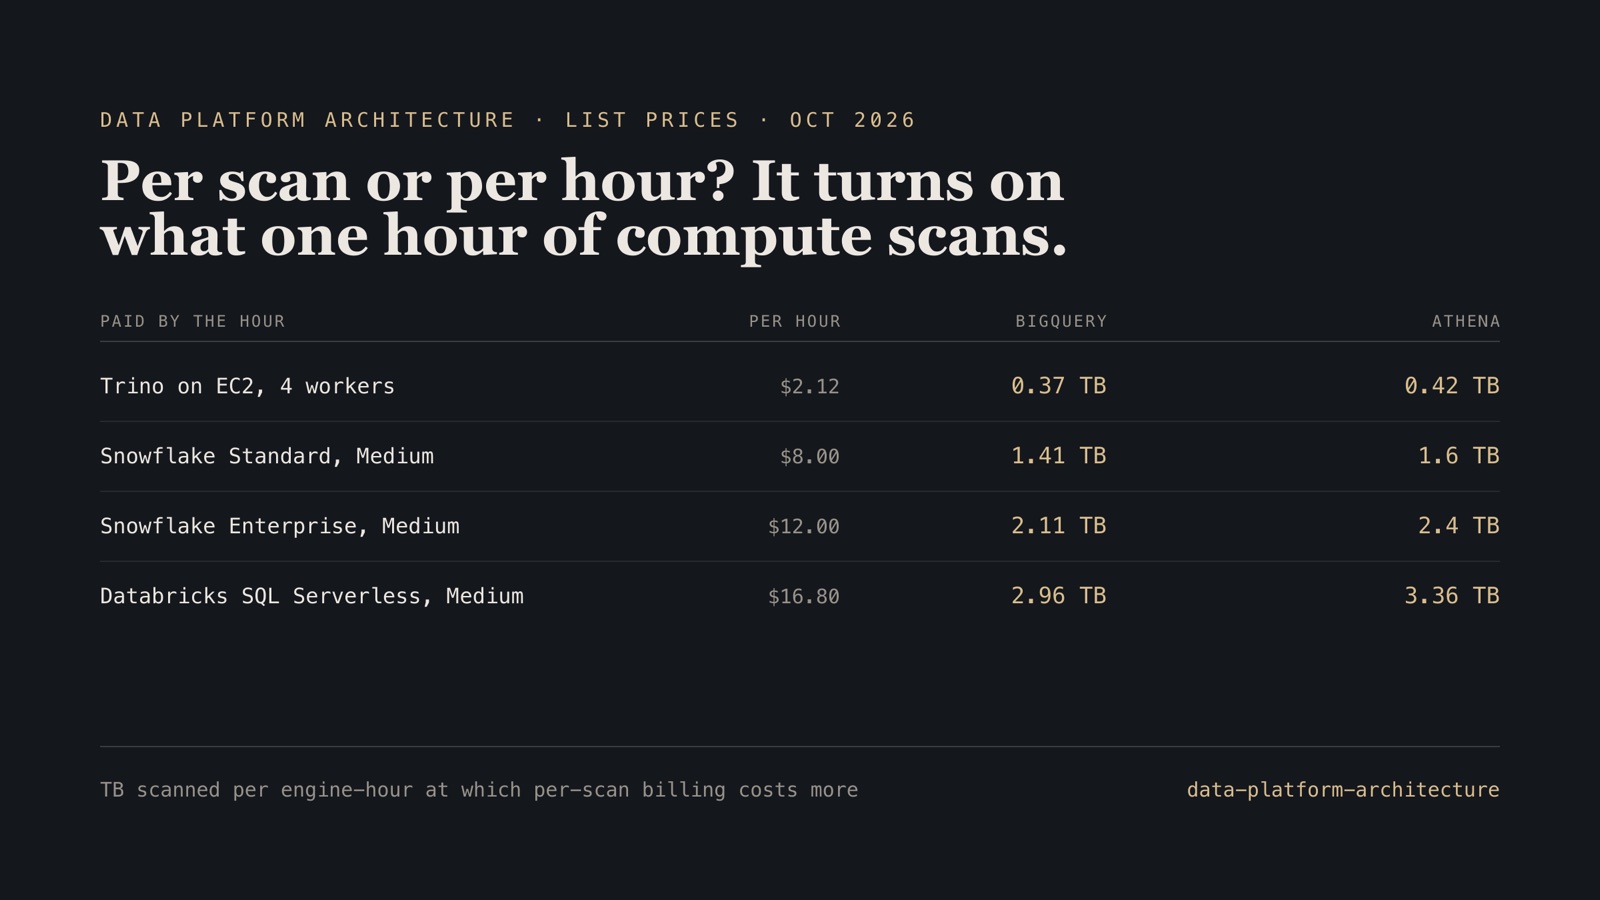
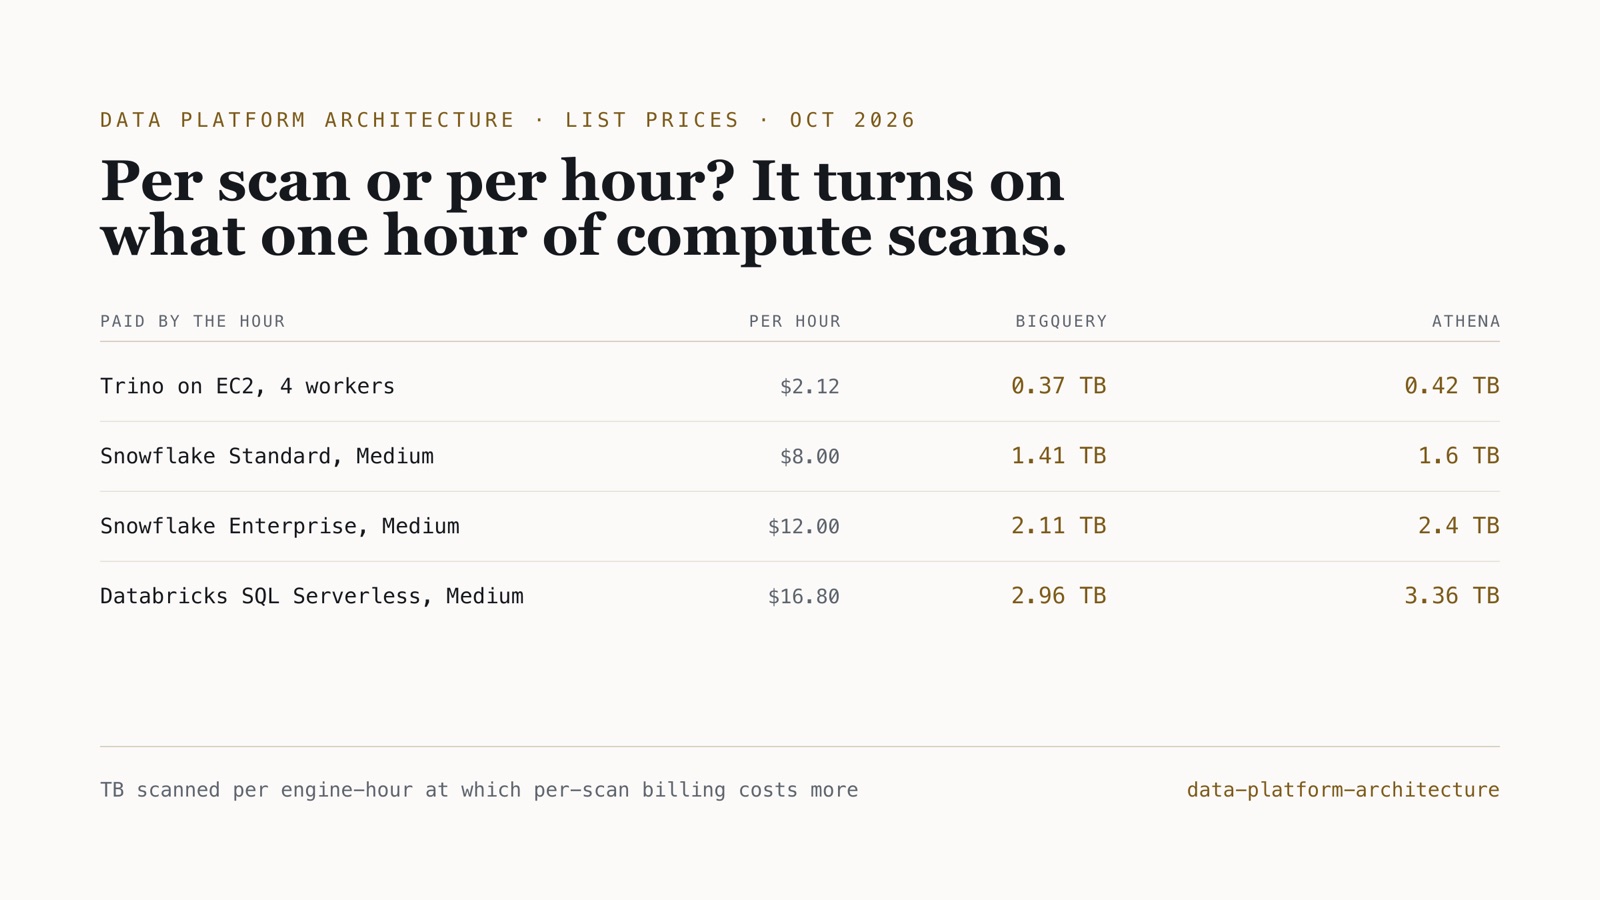
- 1.4–3.4 TB scanned per engine-hour before per-scan billing costs more than a managed warehouse hourly list price of a Medium Snowflake (Standard, Enterprise) or Databricks SQL Serverless warehouse divided by the price per TB on BigQuery on-demand and Athena; AWS us-east-1, BigQuery US, retrieved 2026-10-18 · list prices, Oct 2026
- 9 of 9 failure runs with every event layer exact three controller-broker kills, three TaskManager kills and three 150 s stalls under load; Kafka, ClickHouse, Iceberg and the dead-letter topic reconciled against the generator's ledger by sequence number · Oct 2026
- 96.56% of a month's events lost by high-water-mark loads backfilled newest day first, every run green September 2026 backfilled through an Airflow 3.3 DAG, one run a day from the 30th back to the 1st; event-time and arrival-time watermark models scored against the 89,508 events that arrived · measured Oct 2026
- 909,968 rows recovered by snapshot rollback an over-broad DELETE (a WHERE reaching years further back than intended), then ALTER TABLE EXECUTE rollback_to_snapshot, counted against the pre-incident total · measured 2026 · 2024 stack rebuilt
- Ingest Kafka · CDC · Airflow Events, database changes and vendor files, each with its own failure model (0001).
- Record Iceberg · REST catalog Open tables; engines get scoped credentials, never keys (0002).
- Model dbt Type 2 history for attributes facts are read against (0005); loads by interval (0006).
- Serve ClickHouse · Citus · Trino By access pattern: tenant-keyed, transactional, analytical (0008).
- Operate SLO probes · canaries Freshness from the reader's side (0007); rehearsed restores (0009).
- Choose cost model Per scan or per hour turns on TB scanned per engine-hour (0013).
Context
The public labs on this site each answer a narrow question: does exactly-once survive a broker kill, does a rollback restore a table, which incremental load survives a backfill. An architect’s job is the layer above them: which of those answers a platform should be built on, and how they fit together for one business.
data-platform-architecture is that layer, written for the same fictional SaaS business the data-stack-lab projects generate data for. It has four consumers with different needs: finance and analysts, customers looking at their own usage inside the product, the product’s own features, and models.
Constraints
Everything in it is assembled from public labs on synthetic data. It is not a description of any employer’s or client’s platform, and the workload tiers it prices are assumptions about a plausible business, not measurements of one.
The labs run multi-node clusters on one host, so their results show behaviour (what fails, what is lost, what recovers), not capacity. The managed platforms (Snowflake, Databricks, BigQuery) have not been run against this workload; they are compared from list prices and documentation only, and the decision that depends on them is marked Proposed.
Architecture
- Thirteen decision records: three ways in (events through Kafka, database changes through CDC, vendor files), Iceberg tables behind a catalog that vends scoped credentials, exactly-once with per-layer reconciliation, contracts that wait for consumers, Type 2 history, loads by data interval, freshness measured from the reader’s side, serving by access pattern, rehearsed recovery, three layers of tests, point-in-time features, canary releases, and the managed-platform choice.
- Views: data paths, zones and who may read each, deployment, and a failure-modes table where every row cites a measured recovery.
- Quality targets: freshness, completeness, correctness, recoverability, change safety and release safety, each with how it is measured and what has been measured so far, and a list of what has not.
- Governance and operations: ownership, classification, personal data and erasure, access, lineage; runbooks for backfills, late input, schema changes, failover, restore and tenant skew.
- A platform selection guide and cost model for Snowflake, Databricks SQL Serverless, BigQuery on-demand, Athena and Trino on EC2, priced from list prices quoted with their sources.
In the code
The evidence in each decision record is not written by hand. A build script reads the measured figures from one YAML file and writes them into every record that cites them, and into the decision table in the README. CI runs it in check mode, so a figure that changes in the file but not in a record fails the build, and so does an Accepted decision that cites nothing.
for a in adrs:
    for section in SECTIONS:
        if section not in a["text"]:
            problems.append(f"{a['path'].name}: missing '{section}'")
    for i in a["evidence"]:
        if i not in evidence:
            problems.append(f"{a['path'].name}: unknown evidence id '{i}'")
    if a["status"] == "Accepted" and not a["evidence"]:
        problems.append(f"{a['path'].name}: an Accepted decision must cite evidence")
A second check follows every source link to the lab repository’s file, weekly as well as on every push, so a renamed results file shows up before a reader finds it.
Decisions and trade-offs
| Decision | Alternative considered | Why | What it cost |
|---|---|---|---|
| One file of evidence, generated into the records | Figures typed into each document | A number can only change in one place | A build step, and records that are partly generated |
| Mark measured and modelled decisions differently | Present the whole design with one voice | A reader should know which parts were run | One decision stays Proposed until a managed platform is run |
| Lead the cost model with a break-even | Rank platforms by monthly total | The total mostly ranks the assumed TB scanned per hour | No single “cheapest platform” answer |
| Open tables as the system of record | One managed platform for everything | Engines can change per workload without moving data | Table maintenance and a catalog to run |
| Workload tiers stated as assumptions | Claim a real company’s numbers | Synthetic labs cannot honestly measure capacity | Tier figures are illustrations, not forecasts |
Results
Twelve of thirteen decisions are backed by measured results. Among them: every record exact in 9 of 9 failure runs; 909,968 rows restored by a table rollback; and high-water-mark loads that lost 96.56% of a month when backfilled newest day first, which is why loads go by data interval. All 32 figures, with methods and sources, are in the repository’s EVIDENCE.md.
The platform cost turns on one ratio. From list prices, paying per scan (BigQuery on-demand, Athena) costs less than a Medium Snowflake or Databricks warehouse until one hour of compute scans 1.4–3.4 TB; against self-run Trino the line is about 0.4 TB. Which side a workload falls on is the measurement that decides its bill, and the guide shows how to take it from query history. The reasoning is in the write-up.
What went wrong
The first cost model ranked platforms by total. At every workload tier, the per-scan engines came out cheapest by a factor of ten or more. The ranking was my own assumption about terabytes scanned per engine-hour, printed back. The model now leads with the break-even and prints the assumed ratio next to every total.
Fact-checking caught overstatements before publishing. Drafts said a restore recovered rows “deleted after the target time” (it restored a dropped table), that managed Postgres services cannot run Citus (Azure has offered managed Citus; Amazon RDS and Aurora do not offer it), and that a full scan at the large tier reads 23 TB (that is all stored data; the event history is about 18 TB, so the scan costs about $101, not $131). Each was checked against its source and corrected.
The first diagram tried to show everything. Every cross-cutting service on one chart made a tangle of crossing lines. The README now draws the data path only, and names the registry, probes and canaries in a sentence below it.
What I’d do differently
Measure the managed platforms. Run the same dbt project and the same week of queries on Snowflake, Databricks and BigQuery, and replace the assumed compute equivalence with a measured one. Until then the cost guide is arithmetic.
Build the CDC path. Change data capture is in the design and not in any lab yet; replication slots across a Postgres failover are the first thing it has to prove.
Exercise erasure. The governance document designs deletion of one person’s data across zones, snapshots and serving copies; a test that proves nothing remains would turn that design into evidence.
The decisions, documents, cost model and checks are in data-platform-architecture.
Connected systems
All case studiesdata-stack-lab: dbt, Airflow and data-quality projects, checked against known answers
Author
One project per tool on one synthetic SaaS dataset, each with a result the data can prove
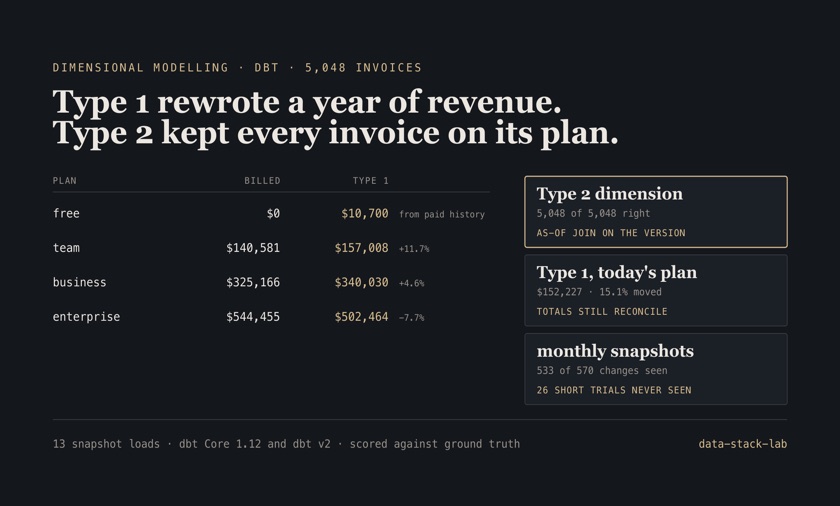
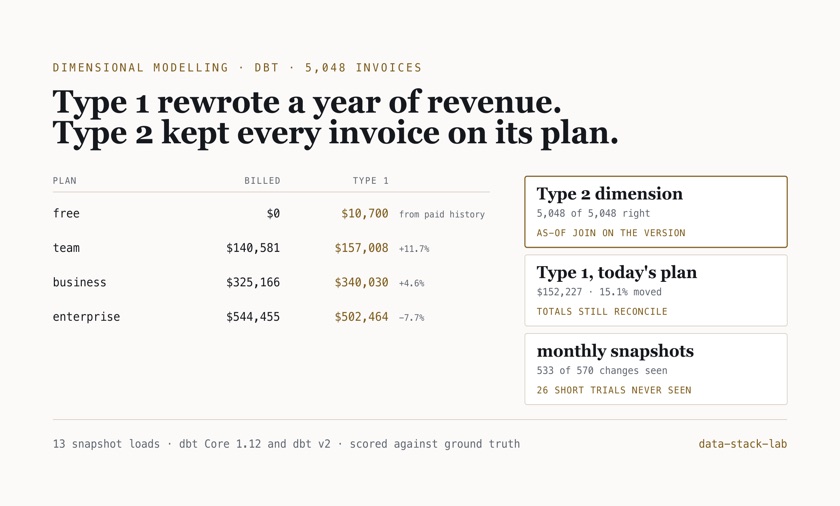
15.1% of a year's revenue on the wrong plan with a Type 1 account dimension5,048 synthetic invoices (seed 7, Oct 2025 – Sep 2026) attributed by each account's current plan and compared with the plan the generator billed; $152,227 of $1,010,202 · measured Oct 2026
4 of 4 deliberate model breaks that failed the buildeach break applied to a copy of the dbt project and built twice, with unit tests and with data tests only; recorded per engine and checked in CI · measured Oct 2026
dbt Core 1.12 · dbt v2 · Apache Airflow 3.3 · DuckDB · dbt snapshots · dbt unit tests
streaming-platform: exactly-once clickstream, counted at every layer
Author
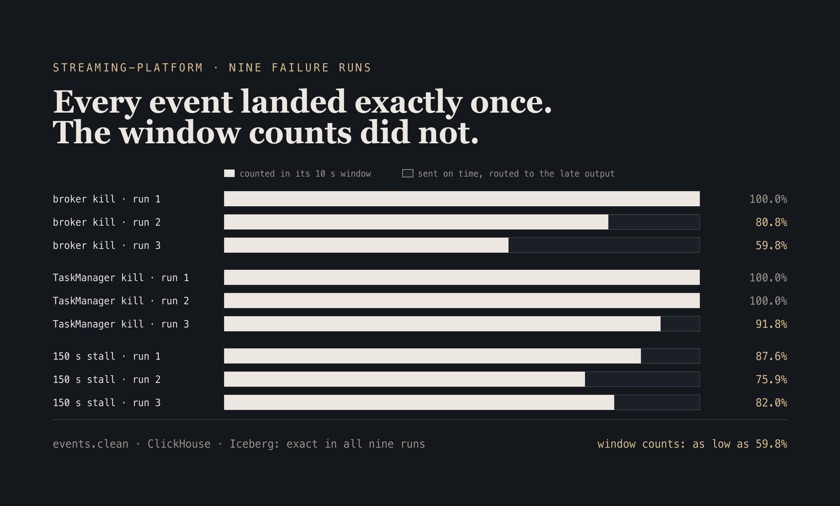
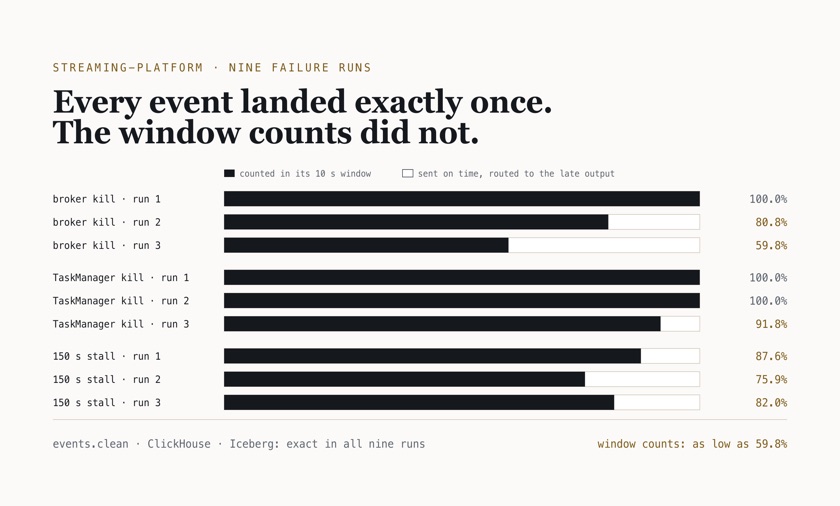
Exactly-once is a claim about counts, so every layer was counted against a ledger, through broker kills, TaskManager kills and stalls
9 of 9 failure runs with every event layer exactthree controller-broker kills, three TaskManager kills and three 150 s stalls under load; Kafka, ClickHouse, Iceberg and the dead-letter topic reconciled against the generator's ledger by sequence number · Oct 2026
59.8% of on-time events left in the window counts after one broker kill118,229 of 197,749 on-time events counted in their 10 s windows in the worst of three broker-kill runs; the rest went to the late side output because catch-up reordered partitions past the 5 s watermark bound · Oct 2026
Apache Kafka 4.3 · Apache Flink 1.20 · ClickHouse · Apache Iceberg · Schema Registry · Avro · Prometheus
dataset-registry: data contracts that wait for the consumers they break
Author
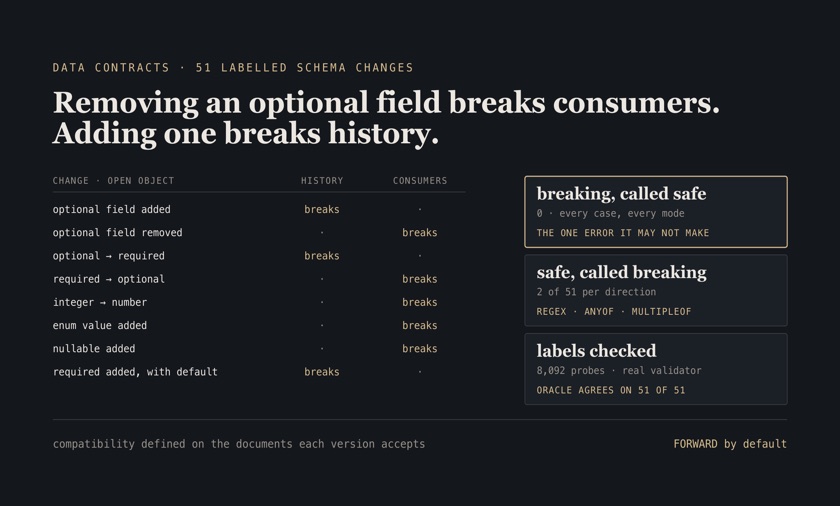
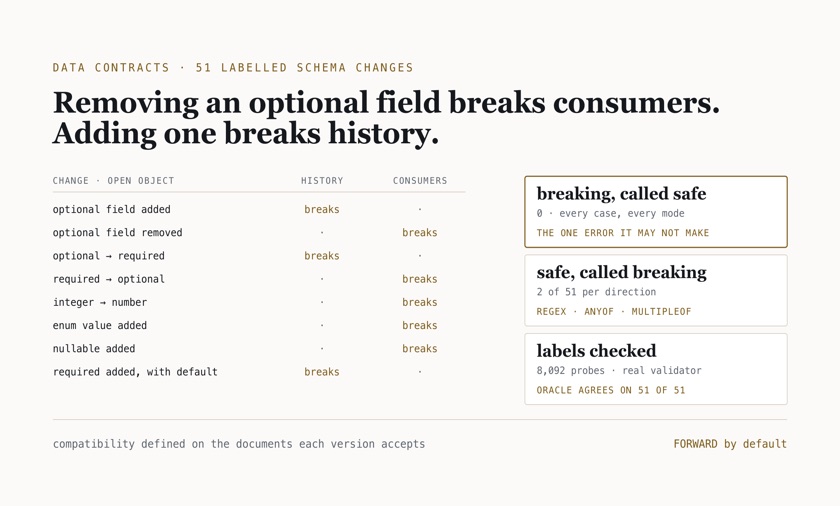
A breaking schema change should be a question to the teams it breaks, asked by a registry that knows who they are
0 breaking schema changes passed as safe, in any mode51 hand-labelled JSON Schema changes, each scored under BACKWARD, FORWARD and FULL; every label cross-checked by an oracle that ran 8,092 generated probe documents through a real JSON Schema validator · measured Oct 2026
2 of 51 changes flagged as breaking that are safe, per directionthe same 51 cases; a widened and a narrowed regular expression, an added anyOf branch and an added multipleOf are flagged in both directions by design, and each truly breaks only one · measured Oct 2026
Go · PostgreSQL 18 · sqlc · OpenLineage · JSON Schema · Next.js
Continue the conversation
See the full career record, or get in touch about a senior data, platform, or AI engineering role.