Problem and decision
ProblemExactly-once is usually asserted from configuration. I wanted it counted: every event at every layer, against a ledger of every fault injected, through the failures that are supposed to break it.
DecisionMake every hop transactional or idempotent, put a reconciler that counts by sequence number at the end of every run, and treat the window aggregates as a separate claim with its own check.
Scope
- Team
- One person
- Scale
- Three KRaft brokers, a Flink JobManager and two TaskManagers, ClickHouse, Iceberg on S3; up to 6,000 events/s; one container per node
- Links
- Source
Outcomes
- 9 of 9 failure runs with every event layer exact three controller-broker kills, three TaskManager kills and three 150 s stalls under load; Kafka, ClickHouse, Iceberg and the dead-letter topic reconciled against the generator's ledger by sequence number · Oct 2026
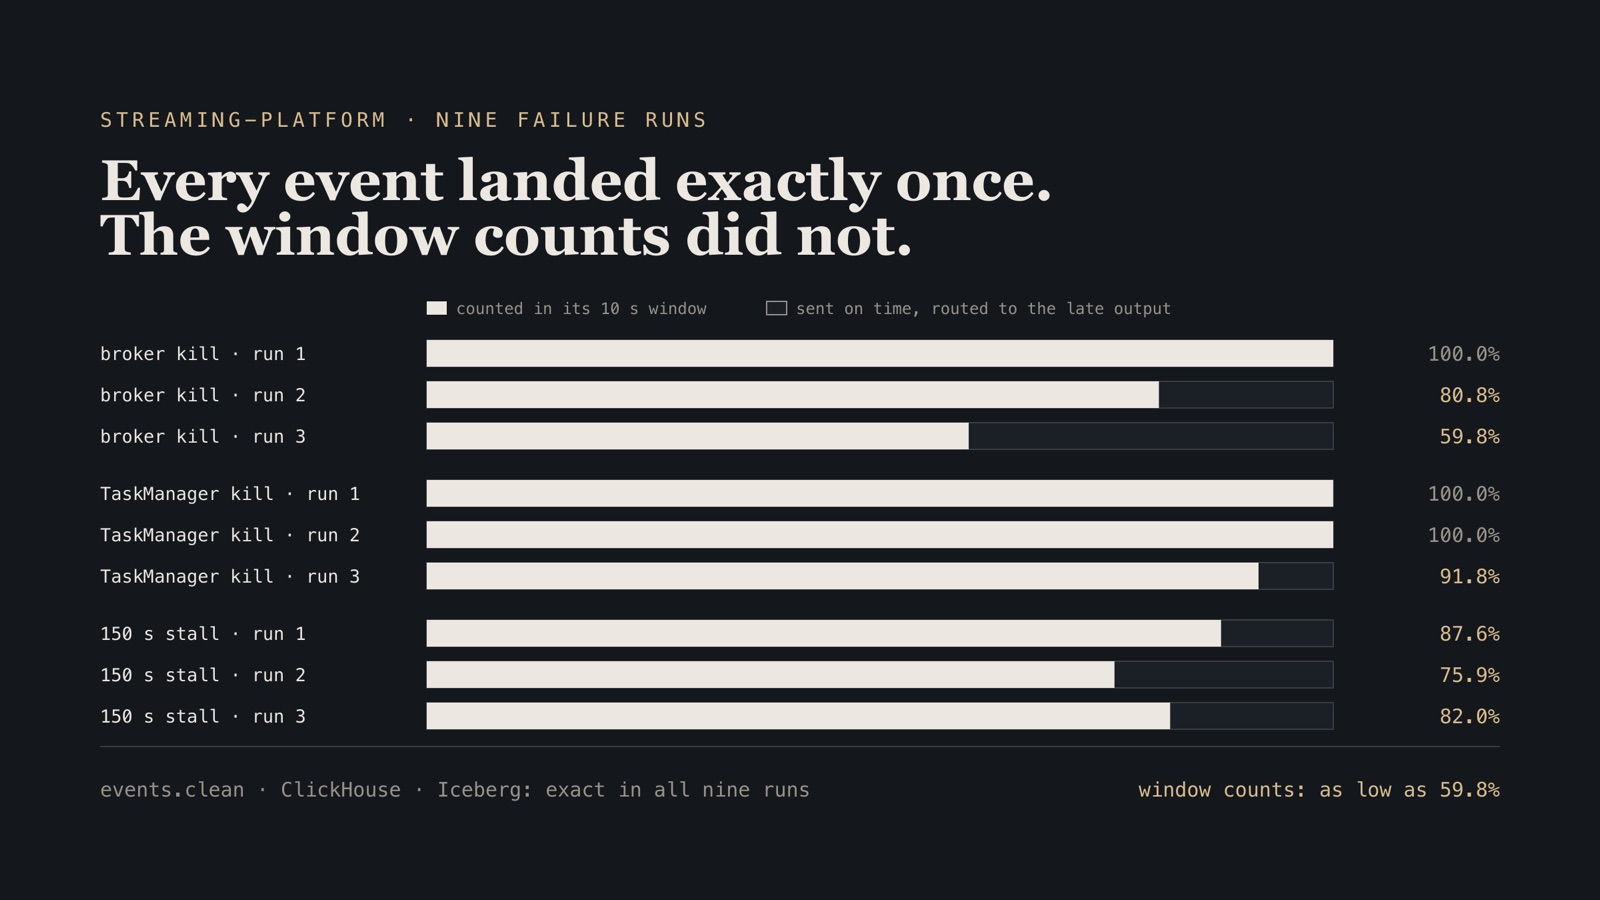
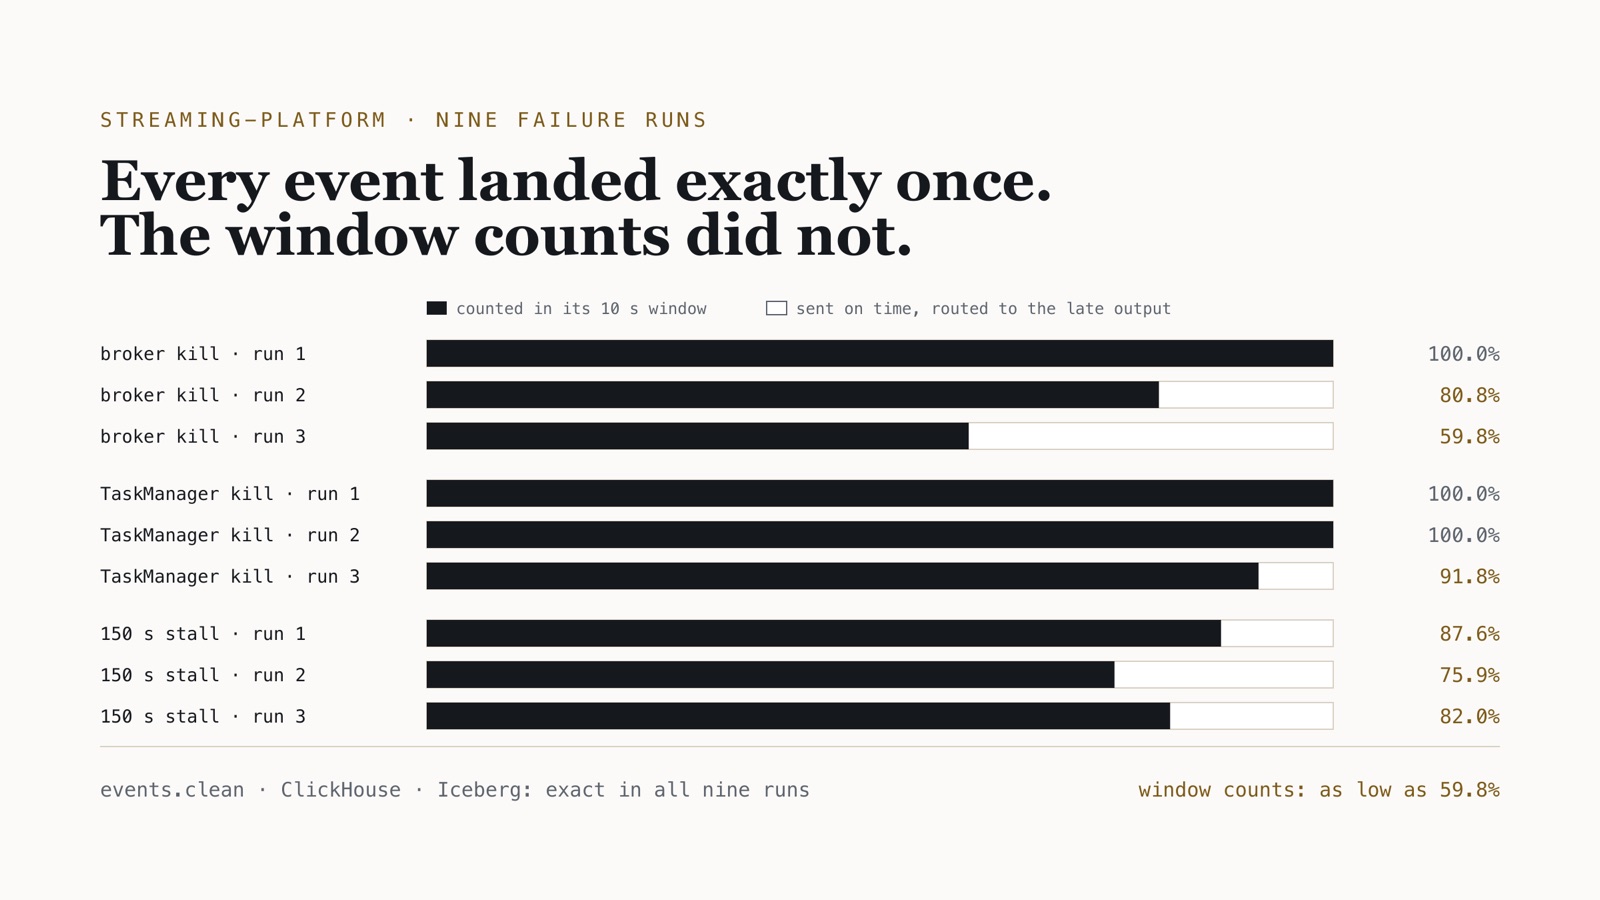
- 59.8% of on-time events left in the window counts after one broker kill 118,229 of 197,749 on-time events counted in their 10 s windows in the worst of three broker-kill runs; the rest went to the late side output because catch-up reordered partitions past the 5 s watermark bound · Oct 2026
- 6.1 s p99 from event time to queryable in ClickHouse at 1,000 events/s ClickHouse ingest time minus event time for every on-time event, median of three 90 s runs; the floor is the 5 s checkpoint interval at which Flink's transactions commit · Oct 2026
- 59–62 s from a frozen pipeline to a firing burn-rate alert both TaskManagers paused for 150 s at 500 events/s; freshness probes every 5 s; multi-window burn-rate rules compressed 12× from the 1 h/5 m pair; alert state polled every second · Oct 2026
- Produce Avro · Schema Registry · Kafka 4.3 Idempotent, acks=all: no failed sends through three broker kills; writes paused ~10 s.
- Gate gatekeeper · Kafka transactions One transaction per batch; the dead-letter topic held exactly the injected poison.
- Dedup Flink 1.20 · Iceberg Both sinks commit on checkpoint; exact through nine failures, aborted writes never read.
- Window Flink SQL · events.late Exact in steady state; one broker kill sent 40% of on-time events to the late output.
- Serve ClickHouse · ReplacingMergeTree At-least-once ingest made harmless by the event key; queryable at p99 6.1–9.1 s.
- Alert probe exporter · Prometheus A probe every 5 s through the front door; a frozen pipeline paged in 59–62 s.
Context
streaming-platform is a real-time data platform for the storefront clickstream of a fictional homewares retailer. Shoppers browse, add to cart, check out and pay, and the events arrive the way real ones do: some twice, some out of order, some minutes late, a few not even valid. Contracts sit at the front door, Kafka and Flink process everything exactly once, ClickHouse answers queries a few seconds old, Iceberg keeps the record, and a freshness SLO pages when the pipeline stalls.
It is a from-scratch reference system, not a production deployment. What makes it worth reading is the reconciler. A seeded generator writes a ledger of every event and every fault it injected; after each run, the reconciler counts the run at every layer — Kafka, Flink’s output, ClickHouse, the Iceberg table, the dead-letter topic, the window aggregates — by sequence number. A layer is exact only when nothing is missing, nothing is there twice, and no poison leaked.
Constraints
All nodes are containers on one Docker VM with 8 vCPU and 11.7 GiB, so replication and network latency are local, and a CPU stall on the host slows every node at once. A broker kill here is process death, not a network partition. Each experiment ran three times; load runs lasted 90 seconds, failure runs 90 to 330. Everything is in MEASUREMENTS.md, with the raw reconciliation reports in results/.
Architecture
A generator sends Avro through an idempotent producer into clickstream.raw. A transactional gatekeeper decodes and validates each batch inside one Kafka transaction, writing valid events to events.valid and bad bytes, with a reason, to events.dlq. Flink 1.20 runs two SQL jobs: clean deduplicates on event_id and writes events.clean through a two-phase-commit Kafka sink and an Iceberg table that commits a snapshot per checkpoint; windows computes 10-second tumbling counts and 30-second sessions by event time and routes anything behind the watermark to events.late. ClickHouse reads every topic read_committed into ReplacingMergeTree tables keyed on the event. A probe exporter sends one synthetic event every 5 seconds through the front door and watches for it in ClickHouse; Prometheus turns those probes into multi-window burn-rate alerts.
Kafka is three KRaft nodes, each broker and controller, with every topic replicated three times and min.insync.replicas=2. Checkpoints run every 5 seconds to S3 on SeaweedFS.
In the code
The window counts were the one layer that did not stay exact, and this split is why: the late filter routes on the same condition the window uses to drop, which keeps every event in exactly one place only while disorder stays inside the 5-second watermark. Catching up after a failure reorders partitions beyond that bound, so on-time events land in events.late, and after a restore CURRENT_WATERMARK is NULL until the first new watermark, so a late event read in that gap is dropped by the window and never routed.
CREATE TABLE events_clean (
  -- …
  -- Out-of-order tolerance: an event up to 5 s behind the newest one seen is on time.
  WATERMARK FOR event_time AS event_time - INTERVAL '5' SECOND
-- …
  INSERT INTO agg_windows
  SELECT window_start, window_end, event_type,
         COUNT(*), SUM(COALESCE(amount_cents, 0)), COUNT(DISTINCT session_id)
  FROM TABLE(TUMBLE(TABLE shopper_events, DESCRIPTOR(event_time), INTERVAL '10' SECOND))
  GROUP BY window_start, window_end, event_type;
  -- …
  -- The window operator drops a record when the watermark has reached the last
  -- millisecond of its window (window_end - 1 ms), not merely its own timestamp.
  -- Route on the same condition so that every event lands in exactly one place.
  INSERT INTO events_late
  SELECT event_id, event_type, event_time, CURRENT_WATERMARK(event_time)
  FROM shopper_events
  WHERE CURRENT_WATERMARK(event_time) IS NOT NULL
    AND TIMESTAMPADD(SECOND, 10 - MOD(CAST(EXTRACT(SECOND FROM event_time) AS INT), 10),
          CAST(FLOOR(event_time TO SECOND) AS TIMESTAMP(3))) - INTERVAL '0.001' SECOND
        <= CURRENT_WATERMARK(event_time);
The whole job, including the parallelism and idle-timeout settings that each fixed an earlier miscount, is in flink/sql/20-windows.sql.
Decisions and trade-offs
| Decision | Alternative considered | Why | What it cost |
|---|---|---|---|
| A transactional gatekeeper in front of Flink | Flink’s avro-confluent format |
The format can fail the job or drop a bad record silently; it cannot route one to a dead-letter topic with a reason | One process with one transactional.id. When its transaction coordinator died, the pipeline waited about 70 s |
Transactions to Kafka, then read_committed into ReplacingMergeTree |
A JDBC upsert sink | Every Flink sink stays two-phase-commit, and ClickHouse gets a replayable source | The 5 s checkpoint interval is the latency floor; ClickHouse’s at-least-once ingest needs FINAL or a merge to be exact |
Avro, FULL_TRANSITIVE, no auto-registration |
BACKWARD; Protobuf |
Producers and consumers deploy in any order, and old data stays readable by new code and the reverse | Every new field needs a default. Three breaking changes were refused with HTTP 409, which is the point |
| Late events to a side output | Allowed lateness with updating windows | Append-only outputs for transactional sinks, and no event silently dropped | A failure’s reordering becomes a lasting under-count in the window table |
| Idle timeout of 60 s | The 10 s it started with | A partition that is only stalled must not be declared idle, or everything it delivers next is late | Windows close up to a minute late when traffic stops |
| A freshness SLO measured by probes | now() - max(event_time) |
A probe measures the whole path and keeps measuring at zero traffic | It does not measure each shopper event; that comes from the reconciler |
| Iceberg REST catalog fixture on SeaweedFS | Hive Metastore, Nessie, Polaris | One small JVM, no database | No compaction or snapshot expiry yet |
Results
In steady state, nine load runs and 2.7 million unique events with every fault injected came out exact at every layer, window counts included. ClickHouse made events queryable at a p99 of 6.1, 6.6 and 9.1 s at 1,000, 3,000 and 6,000 events/s, with the median just above half the checkpoint interval at every rate. Five dashboard queries on 6 million rows answered at a p50 of 8 to 26 ms while ingesting 2,000 events/s.
Through three controller-broker kills, three TaskManager kills and three 150-second stalls, every event layer stayed exact. The idempotent producer saw no failed sends; writes paused for about 10 seconds until the dead broker left the in-sync replicas. Restarts rewrote 658 to 7,522 records that aborted transactions had already written, and no read_committed reader saw them. A frozen pipeline paged in 59 to 62 seconds. The dead-letter topic held exactly the injected poison in every run of every experiment.
The window aggregates did not hold. Every failure moved on-time events into the late side output, up to 40% of one broker-kill run, and two restores lost late events from both the windows and the side output. The analysis takes that apart.
What the measurements refused to show
The aggregates are not exact under failure. Catching up after a stall reads partitions at different speeds, so events.clean carries more disorder than the 5-second watermark bound allows. Restoring the windows job also drops late events that arrive before its first new watermark. The raw table and the lake keep every event; the window tables are fast and approximate during incidents.
It got slower with age. After about four hours of experiments, two 1,000/s runs had a p99 of 23 to 25 seconds instead of 6, with checkpoints stretching to 32 seconds and SeaweedFS at its 512 MB memory cap. They were still exact. It is not root-caused.
The gatekeeper fix is unmeasured. The 70-second stall came from librdkafka’s 30-second connection-setup timeout to the dead coordinator. The timeout is now 5 seconds, and that change has not been re-run.
Building it surfaced bugs outside my code too. A broker healthcheck that started a JVM every 5 seconds held each broker at about 150% CPU, which voided every measurement taken before it was fixed. Kafka 4.1.0’s group coordinator wedged after the VM clock stepped back (KAFKA-19888). And librdkafka 2.16.0 aborted inside a timed-out admin request during broker kills (librdkafka#4605).
What I’d do differently
Run the failures before choosing the window semantics. Append-only windows with a late side output were designed for clients that send late. A failure creates a different kind of lateness — disorder introduced by recovery itself — and that lateness looks identical in the output. Watermark alignment on the deduplicating job’s source, and late events emitted from the window operator itself, are now on the roadmap.
Soak, not sprint. Ninety-second runs on a fresh stack are a best case. The four-hour slowdown only showed up because I repeated the load runs at the end.
Give the broker test a real network. QEMU VMs with tc would add the case containers cannot produce: a partition, where the broker is alive but unreachable.
Connected systems
All case studiesspark-sql-kinesis: a Kinesis source for Spark 4 without the idle-shard floor
Maintainer
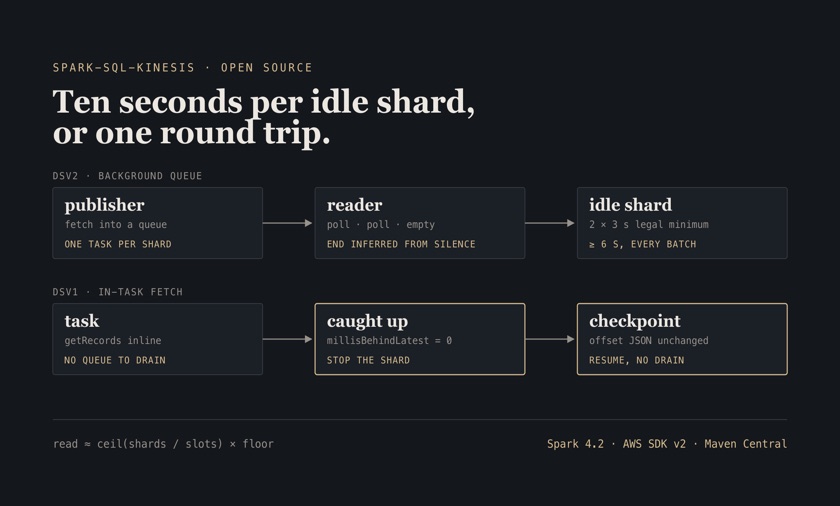
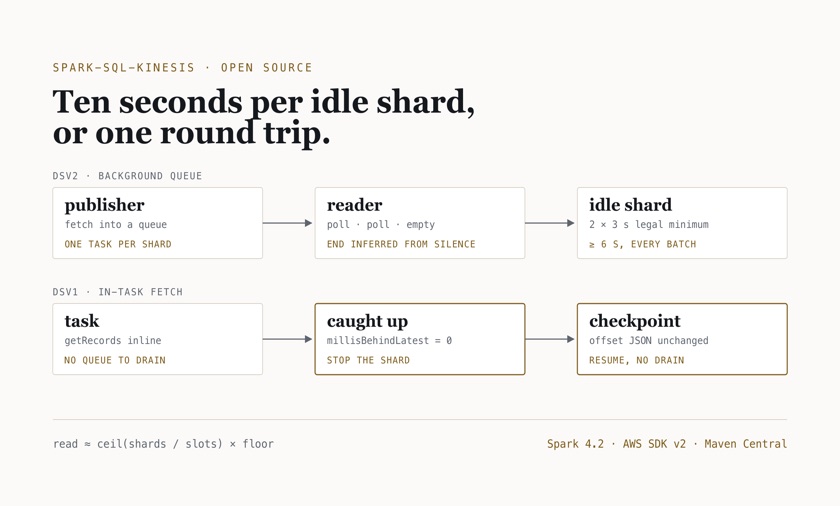
Spark 4 dropped the AWS SDK the streaming connector depended on, and the maintained alternative paid seconds on every idle shard
≥ 6 s per idle shard, every batch, on the alternative connectorconnector source plus staging Spark UI stage timings; floor = empty-poll count × poll timeout, and the connector requires that product to exceed 5 s, so 6 s is the lowest it accepts · Aug 2026, staging
Scala · Apache Spark 4.2 · AWS SDK v2 · Amazon Kinesis · Kinesis Producer Library · Protobuf
dataset-registry: data contracts that wait for the consumers they break
Author
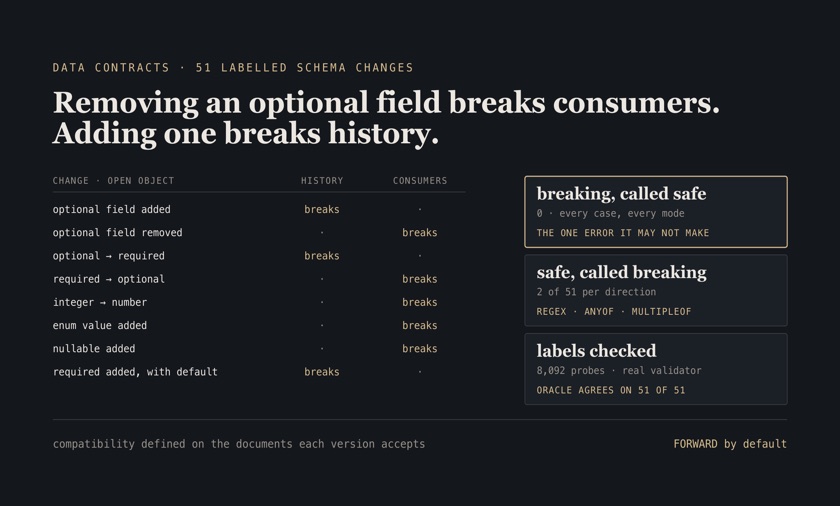
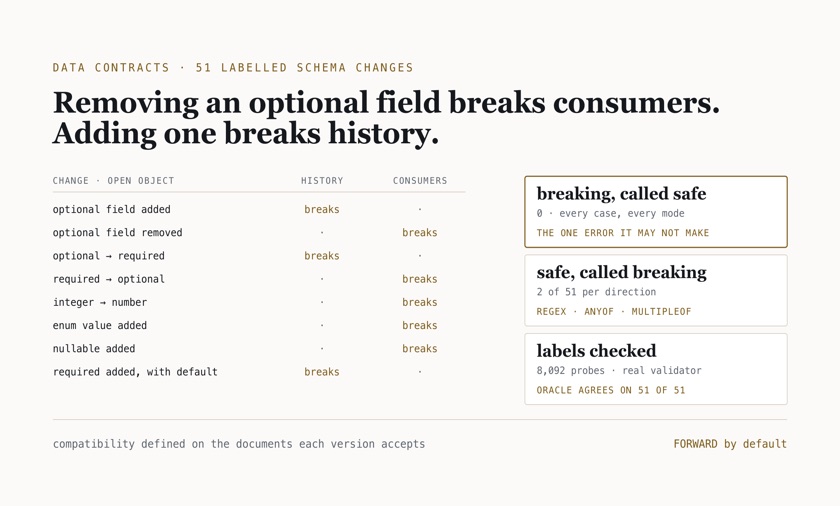
A breaking schema change should be a question to the teams it breaks, asked by a registry that knows who they are
0 breaking schema changes passed as safe, in any mode51 hand-labelled JSON Schema changes, each scored under BACKWARD, FORWARD and FULL; every label cross-checked by an oracle that ran 8,092 generated probe documents through a real JSON Schema validator · measured Oct 2026
2 of 51 changes flagged as breaking that are safe, per directionthe same 51 cases; a widened and a narrowed regular expression, an added anyOf branch and an added multipleOf are flagged in both directions by design, and each truly breaks only one · measured Oct 2026
Go · PostgreSQL 18 · sqlc · OpenLineage · JSON Schema · Next.js
realtime-ml: a fraud model whose leakage, skew and label delay are measured
Author
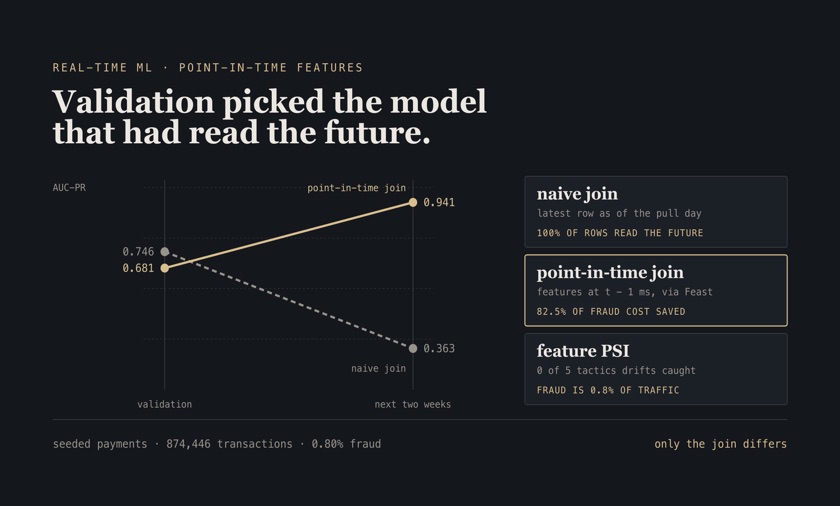
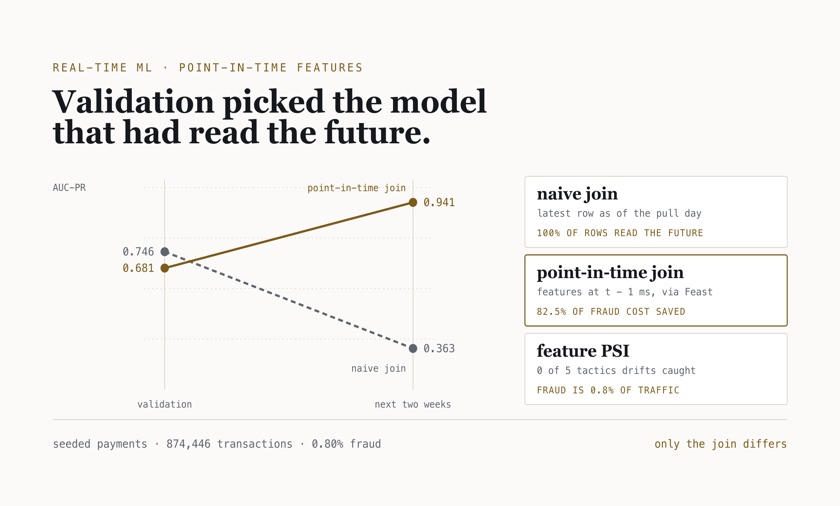
Most real-time models fail before they are served: in a join that reads the future, a backfill that disagrees with the stream, labels that arrive weeks late
0.363 vs 0.941 future AUC-PR, naive join against point-in-time joinsame rows, labels, model and hyperparameters; only the training join differs. Scored on the two weeks after training with point-in-time features and true labels, on seeded synthetic payments (874,446 transactions, 0.80% fraud) · measured 2026-10 · seeded synthetic data
82.5% of fraud cost saved on two unseen weeksa $5 review per flag plus the amount of every missed fraud, against approving everything; threshold chosen on the validation window, true labels. A hand-written rule saved 20.7% · measured 2026-10 · seeded synthetic data
Python · Apache Kafka · Feast · Redis · DuckDB · LightGBM
Continue the conversation
See the full career record, or get in touch about a senior data, platform, or AI engineering role.