On this page
Nine times I broke a streaming pipeline under load. I killed the Kafka broker that was the active controller, killed a Flink TaskManager, and froze both TaskManagers for two and a half minutes, three runs each. Nine times the reconciler came back with the same verdict for every event layer: exact. Nothing lost and nothing counted twice, in Kafka, in ClickHouse, in the Iceberg table or in the dead-letter topic.
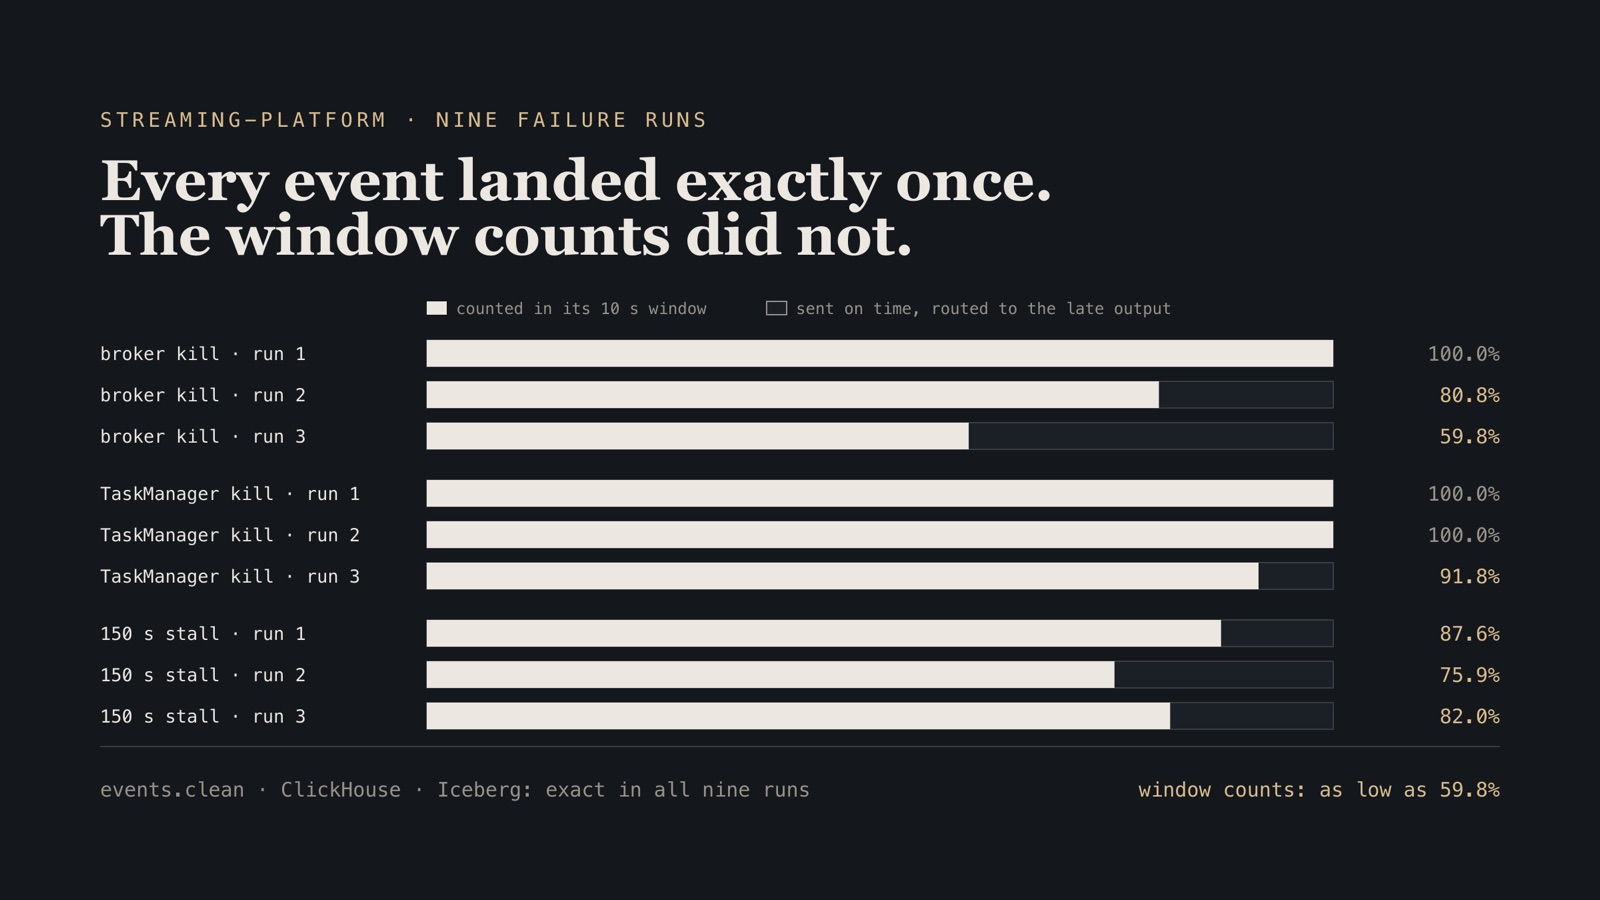
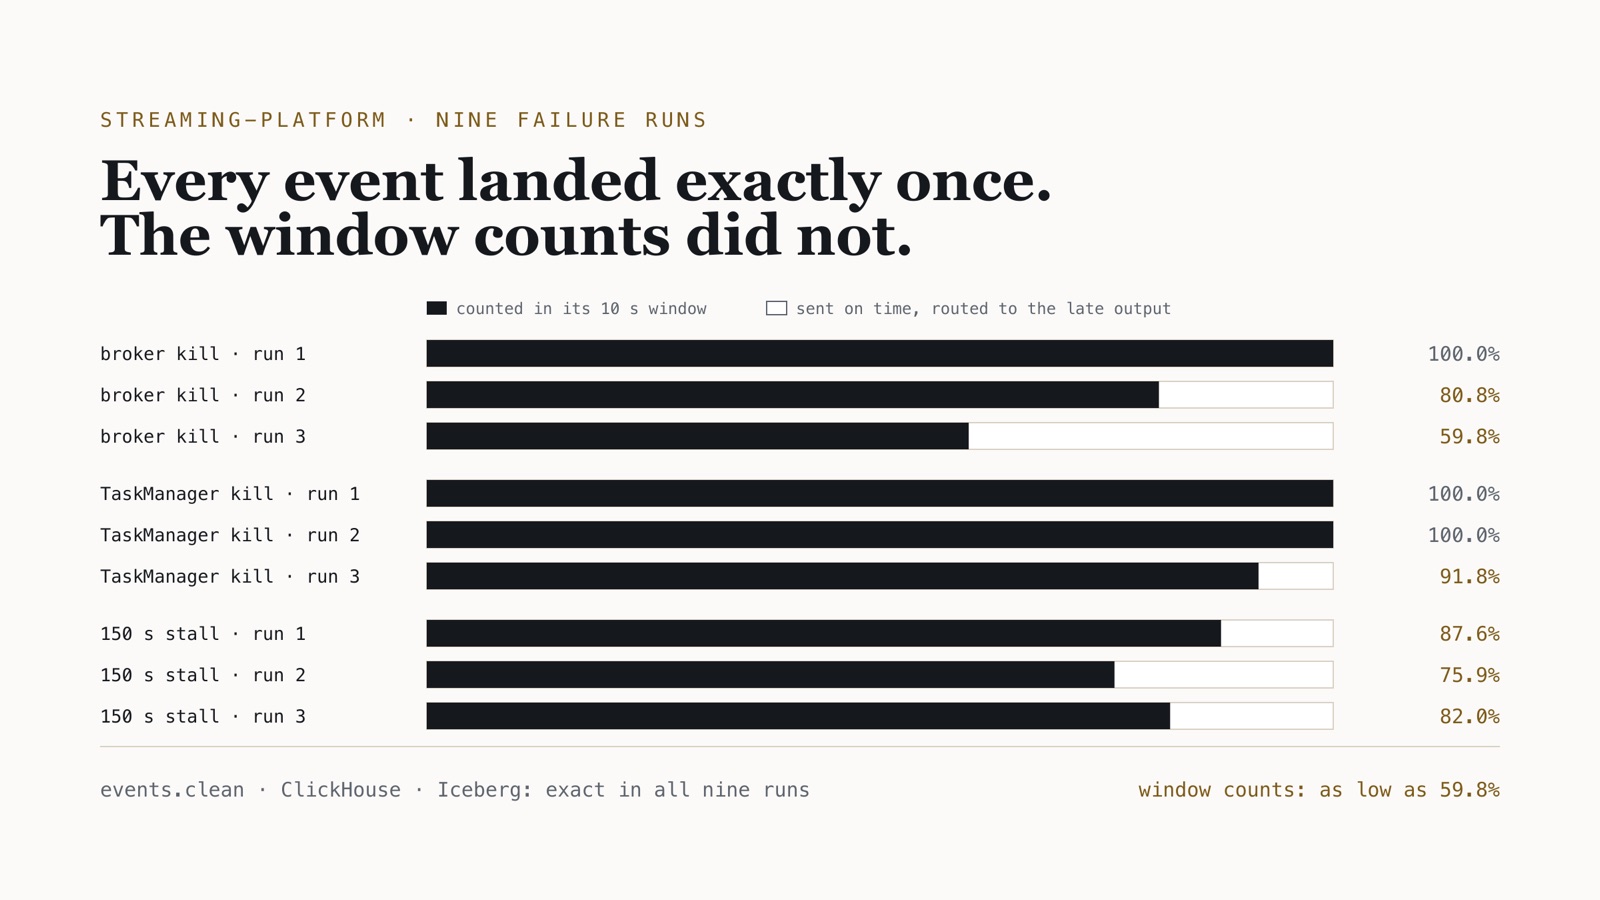
In the worst of those runs, the 10-second window counts held 118,229 of 197,749 on-time events. The other 79,520, 40% of the on-time traffic, sat in the late-events side output, labelled late, although every one had been sent on time. Plotted, that window table reads as traffic collapsing during the incident. The shoppers did not slow down. The pipeline’s sense of time moved.
Operating rule. Exactly-once is a property of records. A windowed aggregate is records combined with a clock, the watermark, and the clock has no transactional guarantee. Reconcile the two separately, and treat window tables as approximate during and after an incident until the late output has been applied.
The system is streaming-platform, a from-scratch clickstream platform for a fictional retailer. Every figure below is from its MEASUREMENTS.md, and the raw reconciliation reports are in the repository’s results/ directory.
What was counted, and against what
The pipeline is Kafka 4.3 on three KRaft nodes, every topic replicated three times with min.insync.replicas=2; a transactional gatekeeper that validates Avro against the schema registry; two Flink 1.20 SQL jobs on a JobManager and two TaskManagers, checkpointing every 5 seconds; ClickHouse reading every topic read_committed; and an Iceberg table on S3. The clean job deduplicates on event_id and writes events.clean and the Iceberg table. The windows job reads events.clean and computes 10-second tumbling counts, 30-second sessions, and a side output of late events. Each node is its own container, and all of them share one Docker VM with 8 vCPU and 11.7 GiB.
A seeded generator plays 200 concurrent shopper sessions and injects faults on top, per event:
| Fault | Rate | What it is |
|---|---|---|
| Late | 1% | Event time 180–300 s in the past, a client that was offline |
| Out of order | 5% | Held 0.2–3 s before sending, event time unchanged |
| Duplicate | 2% | The same bytes sent again 0–2 s later |
| Poison | 0.1% | Not Avro, an unknown schema id, a truncated body, or a broken business rule |
Every send goes into a ledger by sequence number. After a run, the reconciler counts the run’s events at every layer and compares the set of sequence numbers with the ledger. A layer is exact when nothing is missing, nothing is there twice, and no poison leaked. It reads Kafka both read_committed and read_uncommitted, and the difference is what aborted transactions wrote before a restart redid it. One layer is not a table: it checks that the sum of the window counts plus the late side output equals the run’s events, with nothing in both.
ledger             29,999 events · 29 poison · 313 late · 1,487 out of order · 599 resent
events.clean       rows 29,970  unique 29,970  missing 0  unexpected 0   exact
events.late        rows 313   exact
clickhouse.events  rows 29,970  unique 29,970  missing 0  unexpected 0   exact
windows_vs_late    windows 29,657 + late 313 = 29,970   exact
iceberg.events     rows 29,970  unique 29,970  missing 0  unexpected 0   exact
In steady state that split was perfect. Across nine load runs at 1,000, 3,000 and 6,000 events/s, 2.7 million unique events, every out-of-order event was counted in its own window and every genuinely late event went to the side output and to no window. The design worked exactly as specified, as long as nothing failed.
Nine failures, every event layer exact
| Failure, three runs each | Event layers | Records rewritten after an abort | Window counts, share of on-time events | Late events lost from both outputs |
|---|---|---|---|---|
| Active-controller broker killed at 2,000 events/s | Exact, 3 of 3 | 0 | 100.0%, 80.8%, 59.8% | 0, 0, 0 |
| TaskManager killed at 2,000 events/s | Exact, 3 of 3 | 3,556–7,522 | 100.0%, 100.0%, 91.8% | 0, 241, 95 |
| Both TaskManagers frozen for 150 s at 500 events/s | Exact, 3 of 3 | 658–2,135 | 87.6%, 75.9%, 82.0% | 276, 236, 142 |
The event layers held because every hop has its own reason not to lose or duplicate. The producer is idempotent with acks=all. The gatekeeper consumes, validates and produces inside one Kafka transaction per batch. Flink’s Kafka sink opens a transaction per checkpoint and commits it when the checkpoint completes, and the Iceberg sink commits one snapshot per checkpoint. ClickHouse’s Kafka engine is only at-least-once, so its tables are ReplacingMergeTree keyed on the event, and a re-read becomes a duplicate row that a merge or FINAL collapses.
The failure runs show those mechanisms working rather than being assumed. A broker kill stopped writes for about 10 seconds, until the controller fenced the dead broker and shrank the in-sync replicas, and the producer retried through it with zero failed sends. A TaskManager kill was noticed in 8 to 9 seconds and state was restored 10 to 13 seconds after it. In the TaskManager and stall runs, the clean job’s sink had written between 658 and 7,522 records inside transactions that the failure aborted. A read_uncommitted reader would have seen those records, and then seen them again when the restored job rewrote them. No read_committed reader saw them at all.
So the guarantee held, measurably, through the failures it was built for. The last two columns of that table are about something else.
Why on-time events became late
The windows job decides lateness with a watermark: the newest event time it has seen, minus 5 seconds. Once the watermark passes the last millisecond of a window, the window has fired and any record for it is dropped. A separate statement routes records on the same condition to events.late, so that every event lands in exactly one place:
WATERMARK FOR event_time AS event_time - INTERVAL '5' SECOND

-- every event already behind the watermark goes to events.late
INSERT INTO events_late
SELECT event_id, event_type, event_time, CURRENT_WATERMARK(event_time)
FROM shopper_events
WHERE CURRENT_WATERMARK(event_time) IS NOT NULL
  AND <end of the event's 10 s window> - INTERVAL '0.001' SECOND
      <= CURRENT_WATERMARK(event_time);
The 5-second bound is sized for clients: the generator holds out-of-order events for at most 3 seconds, and in steady state the bound absorbed all of them. A failure produces a different kind of disorder, and the pipeline creates it itself.
During a broker failover or a frozen TaskManager, events pile up in Kafka. When the pipeline resumes, the clean job drains its six partitions at different speeds, and re-keying by event_id mixes them, so events.clean carries far more than 5 seconds of disorder. An event from a partition that drained quickly pushes the watermark forward. On-time events still arriving from slower partitions land behind it, and by the only definition of time the job has, they are late. They go to the side output, and the window they belonged to has already been written without them.
None of this is exactly-once failing. The transactions committed precisely the stream that recovery produced. The reordering happened inside the guarantee, so the guarantee preserved it faithfully. The windows plus the side output still summed exactly to the broker-kill runs’ events, with nothing in both. What moved is which side of the line each event fell on.
The amount varied widely. The three broker kills moved 4, 38,023 and 79,520 on-time events. The worst was the run where the killed broker was also the gatekeeper’s transaction coordinator, and the whole pipeline waited about 70 seconds while librdkafka spent its default 30-second connection-setup timeout on a dead host. Between the other two I have no explanation yet.
Two earlier versions of this split were wrong in ways the same reconciler caught. With a 10-second idle timeout, partitions stalled by a leader election were declared idle and the watermark moved on without them, and one broker kill turned 1.7% of a run’s on-time events late. The timeout is now 60 seconds, which costs a minute of delay before the last windows close when traffic stops. And with the windows job at parallelism 2, the late filter and the window operators saw different watermarks, and 452 events were counted both in a window and as late. The job now runs at parallelism 1. Those fixes are why the split is at least consistent under failure, even when it is not right.
The loss only a restore produces
The last column of the table is a real loss, and the TaskManager kill is where I found it.
When the windows job restarts from a checkpoint, its window operators restore their watermark. The source’s CURRENT_WATERMARK starts empty, because it is computed afresh from incoming records. For the first moments after a restore, a late record meets a filter that has no watermark, so the IS NOT NULL condition keeps it out of events.late, and then meets a window operator that does have one, which drops it. Two TaskManager restores lost 241 and 95 late events this way, and the three stalls lost 276, 236 and 142.
Those events are not gone from the system. They are in ClickHouse’s raw events table and in the Iceberg table, because the clean job wrote them before the windows job ever saw them. They are gone from the aggregates and from the side output that was supposed to account for them.
The proper fix is for late records to come out of the window operator itself, through a DataStream side output, so that one component owns the decision. Flink SQL cannot express that, which is why it is on the roadmap rather than in the code.
Where the exactness actually lives
The two sinks keep “exact” in different ways, and the difference explains why the under-count persists.
Iceberg commits a snapshot per checkpoint, and that commit is the moment of visibility, so the lake is exact by construction. ClickHouse gets at-least-once delivery and relies on the table key. In the steady-state runs the Kafka engine never re-delivered anything, so rows before merging equalled rows after. FINAL still has a cost on a table that is being written: the funnel query took 15 ms at the median without it and 24 ms with it, on 6 million rows while ingesting 2,000 events/s. After a ClickHouse restart only FINAL or a merge would be right.
The window tables are append-only by design. I chose a late side output over Flink’s allowed lateness with updating windows, because updates turn the window output into a changelog, and neither the append-only Kafka sink nor a ReplacingMergeTree keyed on the window handles retractions. That choice is sound for a phone that comes back online three minutes later, where a late event is a correction for a backfill. It is the wrong model for recovery, because a failure produces late events by the tens of thousands, all of them for windows that closed seconds ago, and an append-only table has no way to absorb them.
What I would change, in order of cost
- Reconcile the aggregates as their own layer. Windows plus late output must equal on-time plus late events, with nothing in both. That check found every problem in this post. It is cheap enough to run on a schedule against the raw table.
- Mark the window tables approximate during incidents. When a number has to be right, answer from the raw table. Dashboard queries against the raw
eventstable, withFINAL, answered in 13–24 ms at the median here, on 6 million rows that were still being written. - Align watermarks on the deduplicating job’s source, so that catch-up cannot pull partitions further apart than the bound allows. This is the change most likely to remove the reordering itself, and I have not measured it yet.
- Emit late events from the window operator through a DataStream side output, which removes the restore loss.
- Apply late events to closed windows as updates through a changelog sink. It is the complete answer, and it makes every consumer of the window tables handle retractions.
One fix I would not reach for is a wider watermark bound. The 5-second bound is already the floor on how soon a window can close. A bound wide enough to absorb a stall’s catch-up would make every window wait that long, every time, to cover a case that only happens during incidents.
There is one more drift, and it is about speed rather than counts. After about four hours of experiments and 6 million rows, two repeat runs at 1,000 events/s had a p99 of 25.0 and 22.8 seconds instead of 6.1, with checkpoints stretching to 32 seconds and SeaweedFS at its 512 MB memory cap. Both were still exact at every layer. The Iceberg table had only 655 snapshots, so metadata growth is not the obvious cause, and I have not found the real one. A 90-second benchmark on a fresh stack is a best case, and repeating the load runs at the end is the only reason I know that.
Boundary. Every node is a container on one Docker VM (8 vCPU, 11.7 GiB, on an Apple M5 host), so node-to-node latency is local and a broker kill is process death, not a network partition. Docker removes a killed container’s DNS name, which is harsher on librdkafka than a real host failure. Each experiment ran three times; the broker and TaskManager runs lasted 90–100 seconds and the stalls 330. The gatekeeper’s connection-setup timeout is now 5 seconds, and that change has not been re-measured. The load runs used the windows job at parallelism 2 before it moved to 1; that job is not on the path the latency figures measure. Why the broker-kill runs differed so much, and why the stack slowed after four hours, are open.
Frequently asked questions
Does Flink’s exactly-once guarantee make windowed aggregates correct after a failure?
No. Exactly-once guarantees each record is committed once. A window count also depends on the watermark, and recovery can reorder the stream beyond the watermark’s out-of-order bound. In nine failure runs every event layer stayed exact, while 10-second window counts held as little as 59.8% of on-time events, the rest routed to the late side output.
Why do on-time events become late after a Kafka broker or Flink TaskManager failure?
While the pipeline is stalled, events pile up in Kafka. On catch-up the job drains partitions at different speeds, and re-keying mixes them, so the stream carries more disorder than the watermark allows. An event from a fast partition advances the watermark, and on-time events from slower partitions arrive behind it and are treated as late.
Can restoring a Flink SQL job from a checkpoint drop late events?
It did here. Window operators restore their watermark, but the source’s CURRENT_WATERMARK starts empty, so a late-event filter based on it routes nothing until the first new watermark while the windows already drop late records. Two TaskManager restores lost 241 and 95 late events from both outputs; they stayed in the raw table and the lake.
How do you verify exactly-once end to end?
Count it. A seeded generator records every event and every injected fault in a ledger; after each run a reconciler compares the set of sequence numbers at every layer with the ledger, reading Kafka both read_committed and read_uncommitted. A layer is exact when nothing is missing, nothing appears twice, and no poison leaked.
The architecture, the decisions behind each sink, and the rest of the measurements, including freshness and the burn-rate alert, are in the streaming-platform case study. More on Kafka and streaming and data quality.