On this page
- Two pass rates over the same cases are one sample, not two
- What the gate does with a drop it cannot see
- The instrument sits inside the twelve cases
- Asking the judge which answer is better made it worse
- The regression the data could see
- Reproducible, or it is not a measurement
- What goes in an eval release gate
- Frequently asked questions
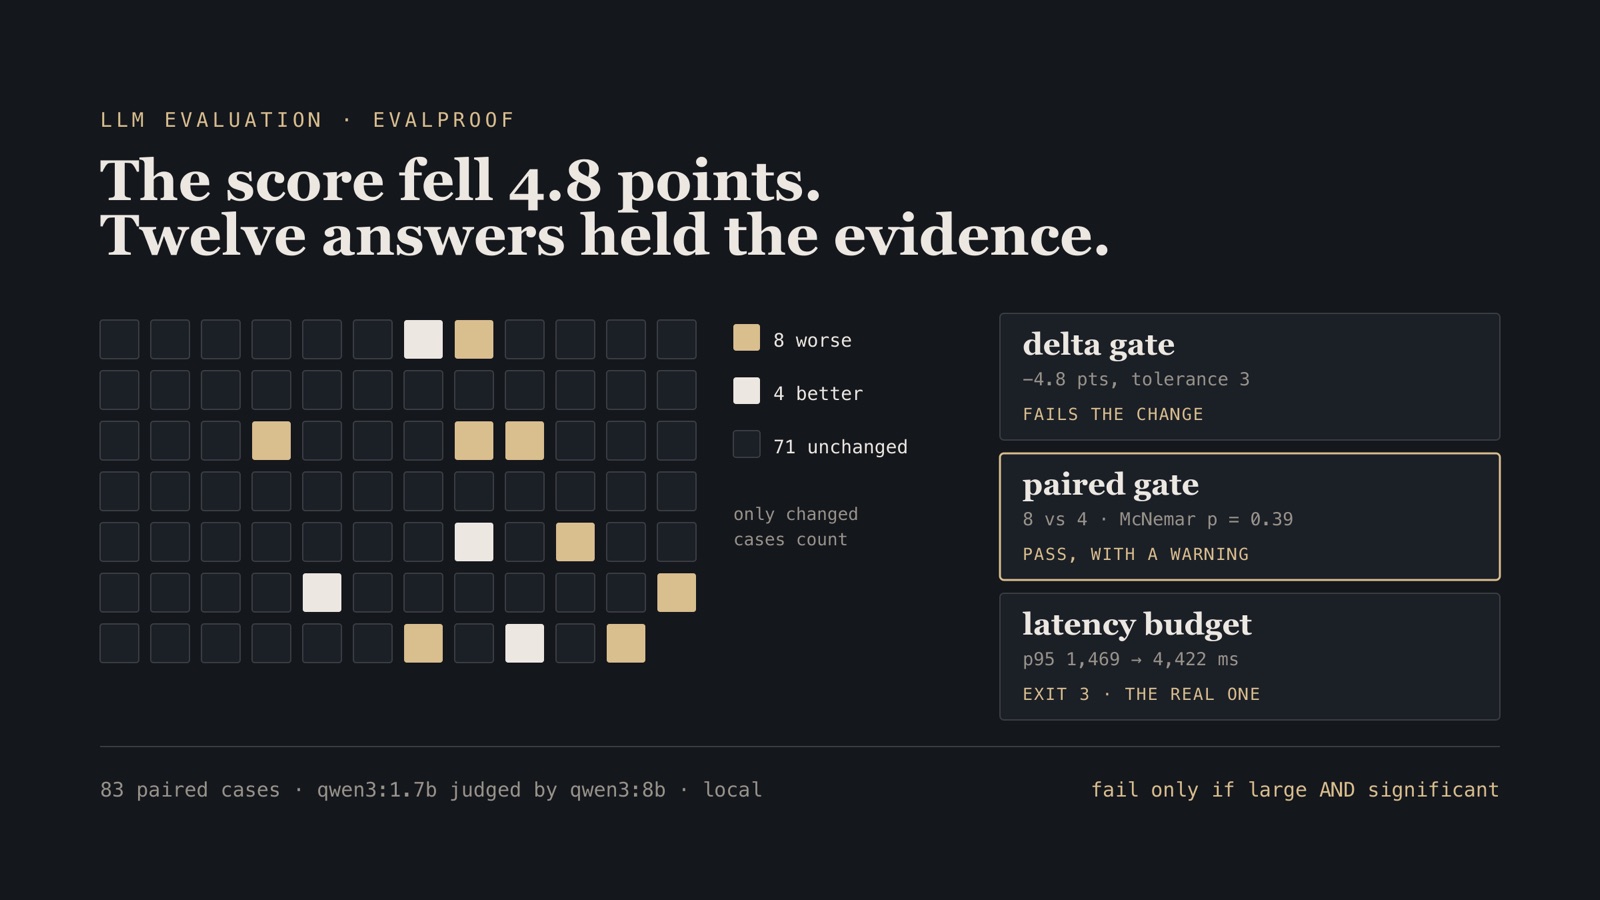
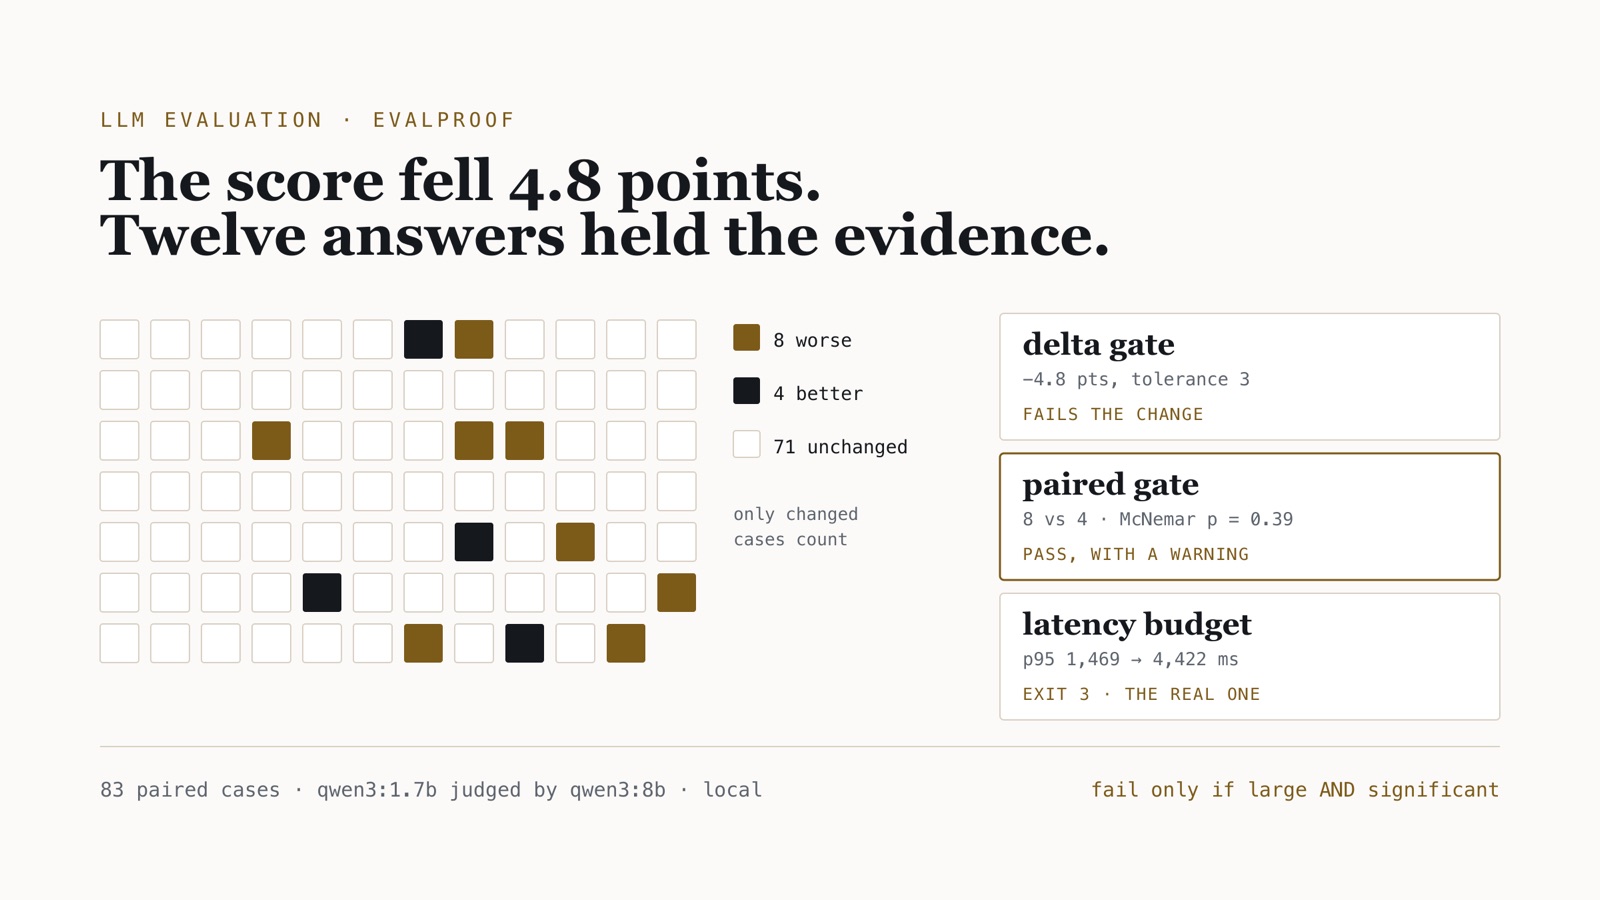
A support assistant answers questions about a product from a page of facts. Someone replaces its grounded system prompt — “answer using only the facts; if they don’t answer it, say so” — with a friendlier one that tells it to “always give a complete answer”. It is the kind of edit that ships on a Friday. The eval runs, and the judge’s pass rate goes from 77.1% to 72.3%.
Most release gates I have seen for LLM features compare those two numbers against a tolerance. With a three-point tolerance, a 4.8-point drop fails the change. The gate I wrote passed it with a warning. Given a latency budget, it then failed it for a different reason. Both decisions were right, and the reasons are the whole of this post.
Operating rule. An eval gate compares two runs over the same cases, so test the paired difference, not the gap between two pass rates. Fail only when a drop is both larger than the tolerance and statistically distinguishable from noise. When it is large but not distinguishable, say so and say how many cases it would take. Gate latency and cost separately, because they are often the regression the data can actually see.
The tool is evalproof, a small open-source measurement layer for LLM evaluation that I wrote to work through this. Everything below comes from runs committed to that repository, made with local models through Ollama: qwen3:1.7b answers, qwen3:8b judges, on 83 questions about a fictional product, 9 of which the facts do not answer. A script in the repo recomputes every table from the committed run files, and MEASUREMENTS.md holds them all.
Two pass rates over the same cases are one sample, not two
The baseline and the candidate answered the same 83 questions. That makes the comparison paired: each question is its own control, and the only thing that varies within a pair is the prompt.
Seventy-one of the 83 questions got the same verdict from the judge in both runs. Those 71 say nothing about which prompt is better — a question both prompts answered well, or both answered badly, is a tie. All of the evidence sits in the other 12: 8 questions the candidate got worse on, and 4 it got better on. The 4.8-point drop is those 12 cases netted out: 8 − 4 = 4 questions, and 4 / 83 = 4.8 points.
If the prompt change made no difference, each of those 12 discordant questions is equally likely to have gone either way, like a coin. The exact McNemar test asks how often 12 fair coins land at least as lopsided as 8 to 4. The answer is p = 0.388. Nearly two times in five, chance alone does that.
| Split of the 12 changed cases | Net drop | Exact McNemar p |
|---|---|---|
| 8 worse, 4 better (what happened) | 4.8 pts | 0.388 |
| 9 worse, 3 better | 7.2 pts | 0.146 |
| 10 worse, 2 better | 9.6 pts | 0.039 |
| 11 worse, 1 better | 12.0 pts | 0.006 |
The first row is the measurement. The rest is arithmetic with the same test, and it shows how little room 83 cases leave. The most favourable case for detection is a change where nothing improved, and even then five cases worse and none better gives p = 0.063. On 83 cases no drop smaller than six net cases — 7.2 points — can reach p below 0.05, whatever the split. A three-point tolerance on this suite promises a sensitivity the data cannot deliver.
A second shortcut is just as common: put a Wilson interval on each pass rate and call the change noise because the intervals overlap. Here they do — 67.0–84.8% against 61.8–80.8% — and the conclusion happens to match, but the method treats the runs as two independent samples and throws away the pairing. Six answers worse and none better would put the candidate at 69.9%, with an interval of 59.3–78.7% that still overlaps the baseline’s widely, yet the paired test gives p = 0.031. Comparing intervals is not a cheaper version of the paired test; it is a different and less sensitive question.
The repository’s continuous integration holds the gate to this on every commit, with no model involved. An offline keyword router for support tickets has four versions over 60 labelled tickets. One version “tidies” its billing keywords and gets 11 tickets worse and none better: −18.3 points, p = 0.001, and the gate exits 1. Another adds a single keyword and gets 2 worse and none better: −3.3 points, beyond a two-point tolerance, but p = 0.5, so the gate passes with a warning. A delta gate would fail both, and only one of them deserves it. CI asserts both exit codes.
What the gate does with a drop it cannot see
The rule evalproof applies is narrow on purpose. It fails on a quality regression only when the drop is at least max_drop and p is below alpha. A large drop that is not significant passes with a warning naming the sample size. A significant drop smaller than the tolerance passes with a warning. Fewer paired cases than min_cases, or two runs over different datasets — the run file records a dataset hash — mean it refuses to gate at all, with its own exit code.
That rule has an honest cost, and it is better to state it than to tune it away. If the prompt change really is 4.8 points worse, this suite will usually miss it. Taking the observed rates as the truth — 8 of every 83 cases worse, 4 better — I simulated the gate with a fixed seed. At 83 cases it caught the regression 13% of the time. It needed about 520 cases for an 80% chance. The fix for a gate that cannot see a regression is more cases, not a looser threshold. The warning says exactly that, because “add cases before trusting either direction” is the only true statement available.
I chose to accept that rather than lower the bar, for the reason recorded in the repo’s decision log: on a few dozen cases most few-point drops are noise, and a gate that fails on noise gets switched off. Once it is off it catches nothing, including the 18-point regression. For the same reason the gate tests one metric. Testing five independent metrics at α = 0.05 each fails a harmless change close to one time in four, so the others are reported but not gated.
The instrument sits inside the twelve cases
A judge model is a classifier with error rates, and its pass rate is a classify-and-count estimate. Measured against the regex answer key on all 83 baseline answers, qwen3:8b had a true-positive rate of 92.6%, a false-positive rate of 6.7% and a Cohen’s κ of 0.78. That is a good judge for its size. It is not a perfect one, and its errors do not stay politely outside the cases that decide the test.
Two of the four “improvements” — questions 56 and 65 — were the judge failing a correct baseline answer because it added a true extra fact the rubric allows. One of the eight “regressions”, question 32, was the same judge error on the candidate. At least three of the twelve discordant verdicts were the instrument, not the prompt.
The gold label was not clean either, and this was the result I least expected. The judge and the answer key disagreed on 13 cases across the two runs, and I read each one by hand. The key was wrong 7 times, the judge 4 times, and 2 were ambiguous. The key’s errors were structural. A regex can confirm that the right fact is present but not that a wrong one is absent. It also cannot tell an abstention from an invention phrased as one. On the question about an uptime SLA, the answer invented 99.9% and 99.99% SLAs, and the key passed it because it matched “no SLA … specified”. On a lifetime-licence question, the answer asserted a policy the facts never state, and the key’s abstention pattern matched “not … provide”.
Corrected on those cases, the key puts the baseline at 78.3% and the candidate at 71.1%, within about a point of the raw judge. Most of the bias that a calibration step “corrected” was the gold’s.
Calibration did what the algebra says on average. Over 200 random gold samples of 30 labels, adjusted classify-and-count and prediction-powered inference removed the judge’s 3.6–4.8-point offset from the key. But they widened the interval by more than half, and the adjusted estimate nearly doubled it: 17.8 points wide for the raw judge rate on the baseline, against 34.1 for the adjusted estimate and 28.6 for PPI. At 83 cases the judge’s bias is smaller than its own noise, so the correction buys little. It earns its place on a large suite, where the raw interval is narrow and the bias dominates — the regime in the prevalence post, where an uncorrected interval covered the truth 0% of the time.
Asking the judge which answer is better made it worse
Pairwise judging — show the judge both answers and ask which is better — is often recommended as more sensitive than scoring each answer alone. I ran it in both orders, 166 calls.
Thirty-five of the 83 verdicts, 42.2%, flipped when the order was swapped. In 32 of those, the answer shown first won both times. evalproof reports a verdict that depends on order as a tie, which removes position bias by construction.
It does not remove length bias. Of the 48 order-consistent verdicts, the judge preferred the candidate 42 times and the baseline 6 — the prompt that both the pointwise judge and the answer key rate lower. In 31 of those 42, both answers were correct by the key, and the candidate’s averaged 383 characters against the baseline’s 78. In 9 of them the preferred candidate answer was wrong by the key.
Without the order swap, an 8B pairwise judge would have reported a decisive win for the worse prompt. That is why evalproof gates on pointwise verdicts and reports pairwise preference only as a diagnostic.
The regression the data could see
The friendly prompt made the answers longer: 19 tokens on average became 77. Longer answers take longer to generate, and every one of the 83 cases records its latency, so this did not depend on a dozen verdict flips. The p50 went from 624 ms to 2,243 ms, the p95 from 1,469 ms to 4,422 ms, and the sequential run time from 363 s to 588 s.
With a 2,500 ms p95 budget, the same comparison exits 3 — budget breach — and still prints the quality warning. Budgets carry their own exit code so a pipeline can treat “slower” differently from “worse”. Here “slower” was the finding: the change tripled tail latency, and a gate that only watched the quality score would have waved it through or failed it for the wrong reason.
Reproducible, or it is not a measurement
Every model call is cached by content, and every run records the dataset hash, seed, Ollama version and model digests. With the cache off, 20 re-run cases gave 20 identical outputs, 20 identical verdicts and 20 identical judge reasons at temperature 0 and seed 0. A warm-cache re-run of the full baseline took 0.05 s instead of 363 s and produced the same results.
Reproducibility also caught a bug of mine. CI on x86_64 Linux failed a known-value test that passed on arm64 macOS: the Wilson interval’s lower bound at zero passes came out as 2.8e-17 instead of 0.0. The bound is computed by subtracting two quantities that are exactly equal at that point, and the rounding differed by platform. Version 0.1.1 pins the boundaries at exactly 0 and 1. It is a small bug, but a statistics library that prints 2.8e-17 for “no passes” on one machine invites a question nobody should have to answer. Known-value tests on the platform CI actually runs on are cheap.
Boundary. One Apple M5 with 24 GB of RAM, two small local models, one fictional domain, 83 cases. The answer key is a stand-in for human review, and the post shows where it is wrong. Determinism was checked on 20 cases on one backend, and the judge ran with thinking disabled; a reasoning judge was not measured. The McNemar thresholds in the split table are exact arithmetic on the same test, not further measurements. The detection rates come from a seeded simulation that assumes this run’s rates are the true ones. The numbers describe this setup. What transfers is the method: pair the cases, test the discordant ones, and audit the gold as hard as the judge.
What goes in an eval release gate
- Run baseline and candidate on the same case ids, record a dataset hash, and refuse to compare runs that differ.
- Test the paired difference: exact McNemar for pass/fail verdicts, a paired bootstrap for continuous scores, with the interval reported.
- Fail only when the drop is beyond the tolerance and significant. Otherwise warn, and name the sample size.
- Know the smallest drop your suite can detect before you choose a tolerance below it.
- Gate one metric; report the rest.
- Measure the judge against gold labels, and audit the gold the same way.
- Swap the order in any pairwise judgement, count flips as ties, and never gate on preference.
- Give latency and cost their own budgets and their own exit code.
Frequently asked questions
Why is a drop in an LLM eval pass rate not enough to fail a release?
Two runs over the same cases are paired, and only the cases whose verdict changed say anything about which version is better. In this run the judge’s pass rate fell 4.8 points on 83 cases, which came from 8 answers getting worse and 4 getting better. The exact McNemar test puts that at p = 0.39: a split that lopsided happens by chance about two times in five.
How does the exact McNemar test work for LLM evaluations?
Ignore every case that passed or failed in both runs. Count the discordant cases, those that got worse and those that got better. If the change made no difference, each discordant case is equally likely to fall either way, so the p-value is a two-sided binomial test with probability one half. On 83 cases no drop smaller than six net cases, 7.2 points, can reach p below 0.05, whatever the split.
How many eval cases do you need to detect a five-point regression?
It depends on how many cases change verdict, not only on the size of the drop. Taking this run’s rates as the truth (8 of 83 worse, 4 better), a seeded simulation of the gate caught the regression 13% of the time at 83 cases and needed about 520 cases for an 80% chance.
Is pairwise LLM judging more reliable than pointwise scoring?
Not in this measurement. With the two answers shown in both orders, 35 of 83 verdicts (42.2%) flipped with the order. Of the consistent verdicts the 8B judge preferred the lower-scoring prompt 42 to 6, mostly where both answers were correct and the preferred one was about five times longer. Pairwise preference is a useful diagnostic and a poor gate.
The code, the run files and every table are in evalproof, with the decisions behind it in the case study. The judge-as-classifier algebra comes from the prevalence post. More on applied ML and evaluation and AI agents in production.