On this page
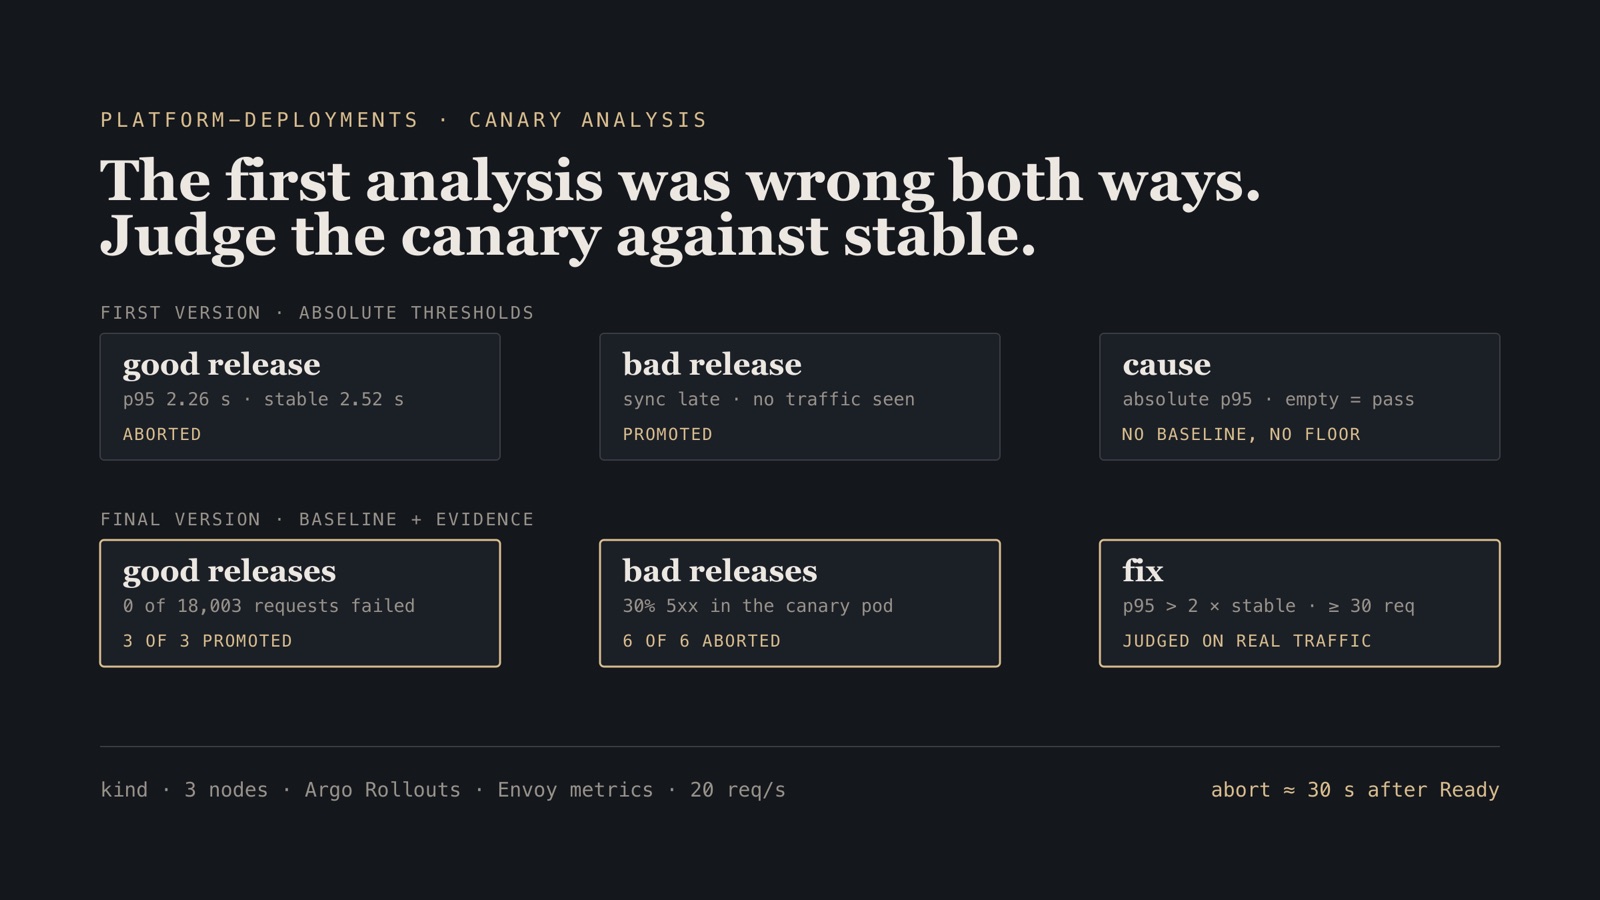
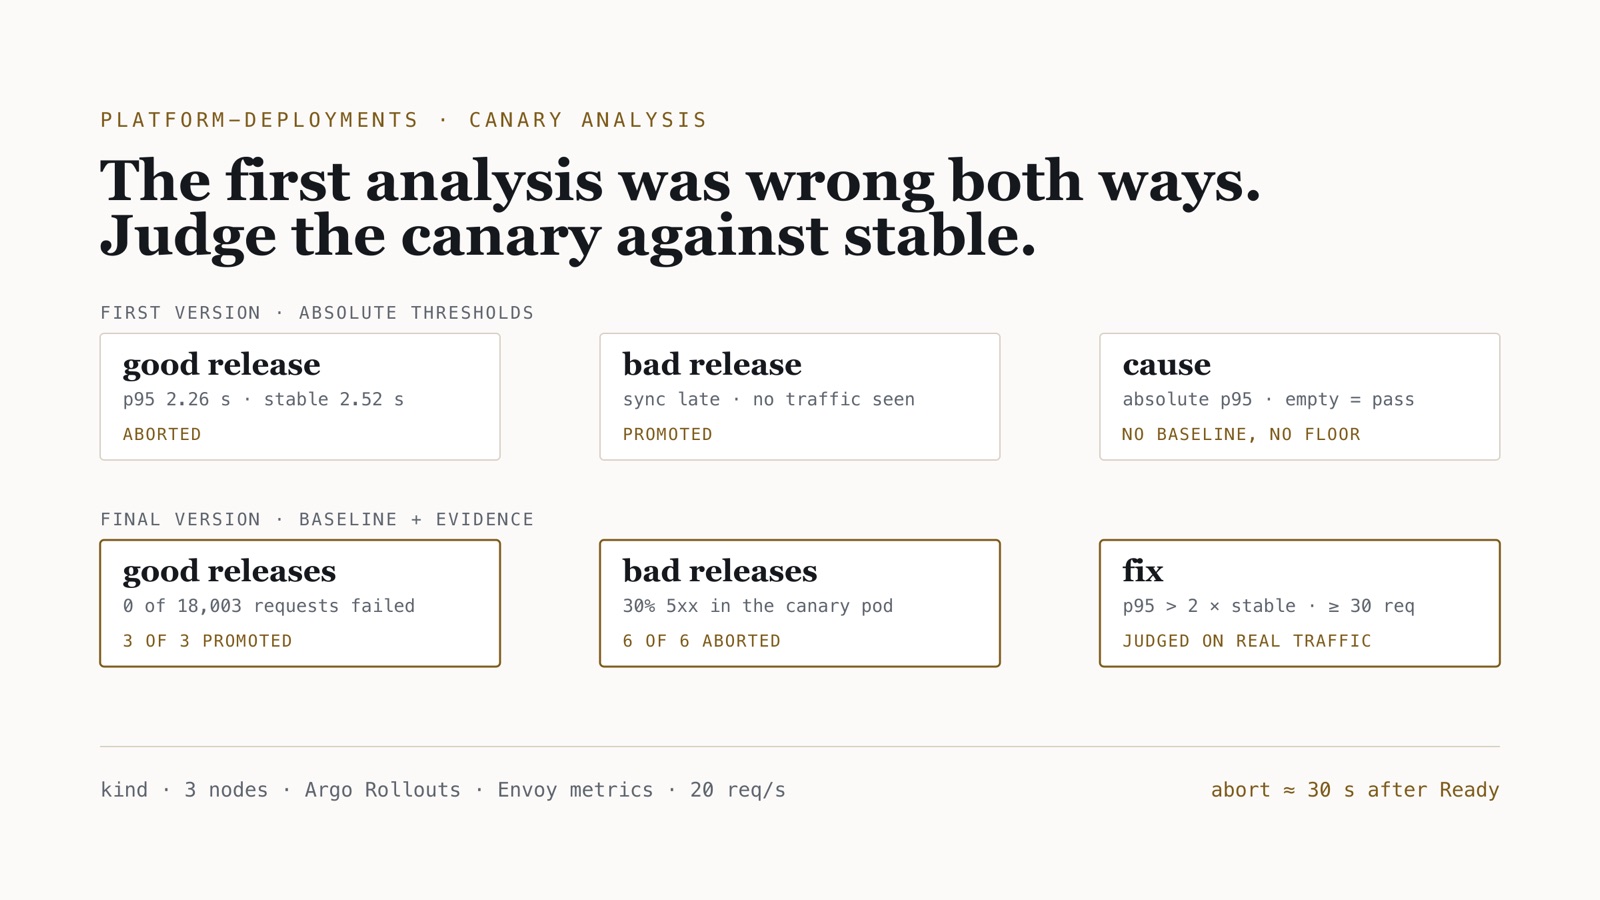
The canary analysis I wrote first was wrong in both directions. It aborted a release that had nothing wrong with it, and in a later run it promoted a release that returned 500 on 30% of its requests. Neither was a bug in Argo Rollouts. Both were the analysis doing exactly what I had told it to do.
After two changes, it held. Six bad releases, six aborts, a median of 30–31 s after the bad pod became Ready. Three good releases promoted under load with no failed request among 18,003. The numbers come from platform-deployments, a GitOps platform I built to deploy an application I had already written, and every figure here is in its MEASUREMENTS.md with the raw output beside it.
Operating rule. A canary analysis is only as good as two things it is easy to leave out: a baseline to judge against, and a floor of evidence below which it refuses to judge at all. Without the first, a slow cluster fails good releases. Without the second, a quiet minute ships bad ones.
The rig, and how a release is made bad
The cluster is kind: one control plane and two workers, each a container. All three run on one Docker VM (8 vCPU, 11.7 GiB) on an Apple M5, so node-to-node latency is local, and a stall on the host stalls every node at once. That last fact turned out to matter more than anything else in this post.
Argo CD installs everything from one root Application in sync waves: CloudNativePG with a two-instance PostgreSQL cluster, Argo Rollouts, Kyverno, a trimmed Prometheus, the OpenTelemetry Collector and Jaeger, then the application. The application is governed-agent v0.1.0, unchanged. Its api runs as five replicas of a Rollout, and a release is a commit to one file on a Git server inside the cluster.
The canary goes 20%, pause 60 s, 50%, pause 60 s, then 100%. Background analysis starts at the first pause. Every 15 s it asks Prometheus two questions about the canary’s own pods over a 30 s window: is the 5xx rate at or under 5%, and is the p95 at or under 500 ms. One failed measurement aborts (failureLimit: 0), which scales the canary away and leaves the stable ReplicaSet serving.
The application has no /metrics endpoint, so each api pod runs Envoy in front of it. Envoy supplies per-pod request counts and a latency histogram, labelled with the pod’s rollouts-pod-template-hash, which is how a query separates canary from stable. It also stamps an x-release header on every reply, so the load generator can count which release served each request.
A bad release switches on Envoy’s HTTP fault filter for the new pods only: 30% of requests get a 500. The fault rides in a runtime layer on that revision’s Envoy command line, so it is part of the pod template; stable pods never see it. Readiness and liveness probes go around Envoy, straight to the application. If they went through it, the bad pod would never become Ready, and the test would measure Kubernetes refusing a pod rather than the analysis catching a release. Readiness already catches the faults a probe can see. This test is for the ones it cannot.
Load is k6 inside the cluster at a constant 20 requests per second, GET /healthz and GET /review-queue at random, with a 10 s timeout. I picked 20 because at 40 the p99 was already 580 ms with no rollout running. The question is what a release adds, so the load stays where the platform is comfortable.
The good release it aborted
The first version judged p95 against an absolute 500 ms. Over three good-release runs it promoted twice and aborted once.
Nothing was wrong with the aborted release. A stall on the host slowed every pod on the cluster at the same moment. At the abort, Prometheus had the canary’s p95 at 2.26 s over the 30 s window. Stable’s, over the same window, was 2.52 s. The canary was faster than the version it was replacing, and it was rolled back for being slow.
An absolute threshold cannot tell “this release is slow” from “everything is slow right now”. On a shared host the second is common: the same 20 req/s on the same idle cluster gave a p95 of 25 ms on a fresh cluster and 542 ms in a later minute. A production cluster has more headroom, but a noisy neighbour, a GC storm in a shared dependency or a slow database will produce the same picture. The canary should be judged against what it replaces, measured over the same window, because then the cluster’s bad minute cancels out.
The p95 query now returns the canary’s p95 only when it is also more than twice stable’s; otherwise it returns 0 and the 500 ms condition passes:
- name: p95-latency-ms
  interval: 15s
  initialDelay: 30s
  failureLimit: 0
  successCondition: "isNaN(result[0]) || result[0] <= 500"
  provider:
    prometheus:
      query: |
        (
          histogram_quantile(0.95, sum by (le) (rate(envoy_http_downstream_rq_time_bucket{<canary pods>}[30s])))
          > on() (2 * histogram_quantile(0.95, sum by (le) (rate(envoy_http_downstream_rq_time_bucket{<stable pods>}[30s]))))
        )
        or on() vector(0)
The ratio has a hole the error check does not: if no stable pods serve traffic, stable’s p95 is undefined and the query returns 0, a pass. Background analysis ends at promotion, so stable pods exist for every measurement in this design. The 5xx check stays absolute at 5%: a stall made every pod slower, but no good release in these runs came near that error rate, the worst failing 8 requests in about 6,000.
The bad release it promoted
The second failure was worse, and it came from an earlier set of bad-release runs. A host stall delayed Argo CD’s sync of the release commit by 226 s. By the time the bad pod was Ready, k6 had finished. The analysis ran its measurements on schedule, and every one returned [0]: no requests, so no errors and no latency. Every check passed. The rollout reached 100% and the bad release was promoted. The raw run is in the repository as results/bad-canary-promoted-without-traffic.jsonl, and it shows the bad release serving zero of the load generator’s requests.
Passing on no data is deliberate, and I would keep it. An empty window is not evidence of failure, and an analysis that fails whenever traffic dips will abort every release shipped at three in the morning. But “not evidence of failure” is not evidence of success either, and the steps that decide promotion had no way to say so.
The fix is one more step, the last before 100%: did the canary serve at least 30 requests in the past three minutes? If not, abort.
- name: canary-requests
  count: 1
  successCondition: "result[0] >= 30"
  failureCondition: "result[0] < 30"
  provider:
    prometheus:
      query: |
        sum(increase(envoy_http_downstream_rq_total{<canary pods>}[3m])) or vector(0)
The cost showed up immediately. The platform change that added this step could not promote either, because nothing was calling the api. It went out under 20 req/s of synthetic traffic. That is the policy now: no traffic, no release. Shipping in a quiet period means sending synthetic traffic or promoting by hand, and promoting by hand is a decision with a name on it.
What 20% means without a traffic router
There is no service mesh or Gateway API router here, so Argo Rollouts sets weight by replica count. With five replicas, 20% is one canary pod behind the same Service as four stable ones. I expected that pod to see roughly a fifth of the requests. It did not, and how far it missed depended on the client.
| client | runs | bad share while the canary was Ready | requests failed per run | first bad pod Ready → abort |
|---|---|---|---|---|
| new connection per request | 3 | 12.0–13.4% | 32–39 | 30–31 s |
| keep-alive (k6 default) | 3 | 1.7–10.9% | 11–25 | 30, 31, 75 s |
A kept-alive connection stays on the pod it first reached, so a pod that becomes Ready mid-test only gets connections opened after that moment. Most HTTP clients keep connections alive. In the slowest keep-alive run the canary served 32 requests in total, the first three measurements saw no failure, and the abort took 75 s. The new-connection share sits below 20% too, partly because the window includes the canary’s last seconds of draining, when it no longer accepts new connections.
Two consequences. A canary’s weight is a hint about exposure, not a measurement of it; count requests by release if exposure matters. And the analysis has to catch a bad release from whatever sample it gets, which is another reason the evidence floor counts requests rather than trusting the weight. A traffic router would set the share per request, and that is first on the repository’s roadmap.
Detection is the initial delay
The analysis waits 30 s before its first measurement. Without that delay, a good canary’s cold first requests (Python imports, connection pools warming up) failed the p95 check. With it, in five of six bad-release runs the very first measurement already saw a 5xx rate of 0.24–0.31 against a 5% limit. The median abort landed 30–31 s after the bad pod became Ready. The detection time is the delay, almost exactly.
So the delay is the price of not aborting good releases on warm-up, and it is paid on every bad release as 30 s of real exposure. Over a whole run the bad release caused 11–39 failed requests out of about 4,800 (0.2–0.8%). After the abort its pod takes about 17 s to disappear, because it drains before exiting, but it leaves the Service’s endpoints at the start of that.
The last failures were not the canary’s
Once the analysis stopped aborting good releases, good releases still failed one to three requests in about 6,000. The obvious suspect was connections outliving a pod’s removal from the Service, so I had Envoy drain client connections on shutdown. It made no difference: 5, 5 and 2 failures.
Every failure was a 5xx, and the application had logged no errors. The pattern fitted a different race: uvicorn closes idle keep-alive connections after 5 s, and Envoy, reusing such a connection at the wrong moment, sends a request into a socket the application is closing. Envoy now closes idle upstream connections after 4 s, before uvicorn can, and retries once any request the application never received (reset-before-request, safe for any method). Three runs, no failures. Sampled pods afterwards showed Envoy closing idle connections and no retries, which fits the race but does not prove it. The 5xx access log stays on so the next occurrence can settle it.
This belongs in a post about canaries because those one-to-three failures would have been blamed on the release. A rollout that fails a few requests per thousand looks like a release problem from the outside. Here it was a timeout mismatch between two components that never changed.
What this rig cannot show
Every result above is from three nodes sharing one VM. That made host stalls a recurring character, which turned out to be useful: both analysis failures were found because the host was noisy. It also means nothing here measures cross-node network behaviour, real disk failure or cloud load balancers.
Weights are replica ratios, so this design cannot run a 1% canary. Observability is trimmed to the counters the analysis uses, with no recording rules, alerting or dashboards, and the same Envoy metrics are not yet wired to SLO alerting rules. The AWS version of the platform exists only as Terraform that is validated, linted and scanned, and has never been applied. That is all that is known about it.
The checks I would now ask of any canary setup, wherever it runs:
- Does the latency check compare the canary with stable over the same window, or with a constant the whole cluster can cross at once?
- What does each query return on an empty window, and is there a step that refuses to promote on no evidence?
- How many requests does the canary actually receive, counted by release, from clients that keep connections alive?
- How long is the initial delay, and is that exposure acceptable on every bad release?
- When a good release fails a handful of requests, has anyone checked that the release caused them?
The case study covers the rest of the platform: bootstrap time, admission policies, the node drain, and the fifteen problems the measurement runs found on the way.