Problem and decision
ProblemA rolling update checks readiness, and readiness cannot see a release that starts fine and then fails a share of real requests. I wanted releases that stop themselves on evidence, and numbers for what that costs.
DecisionMake a release a Git commit that Argo CD syncs, ship the api as an Argo Rollouts canary judged on Envoy's per-pod metrics against the stable pods, and refuse promotion without enough canary traffic to judge.
Scope
- Team
- One person
- Scale
- kind cluster, one control plane and two workers; 38 pods across eleven Argo CD Applications
- Links
- Source
Outcomes
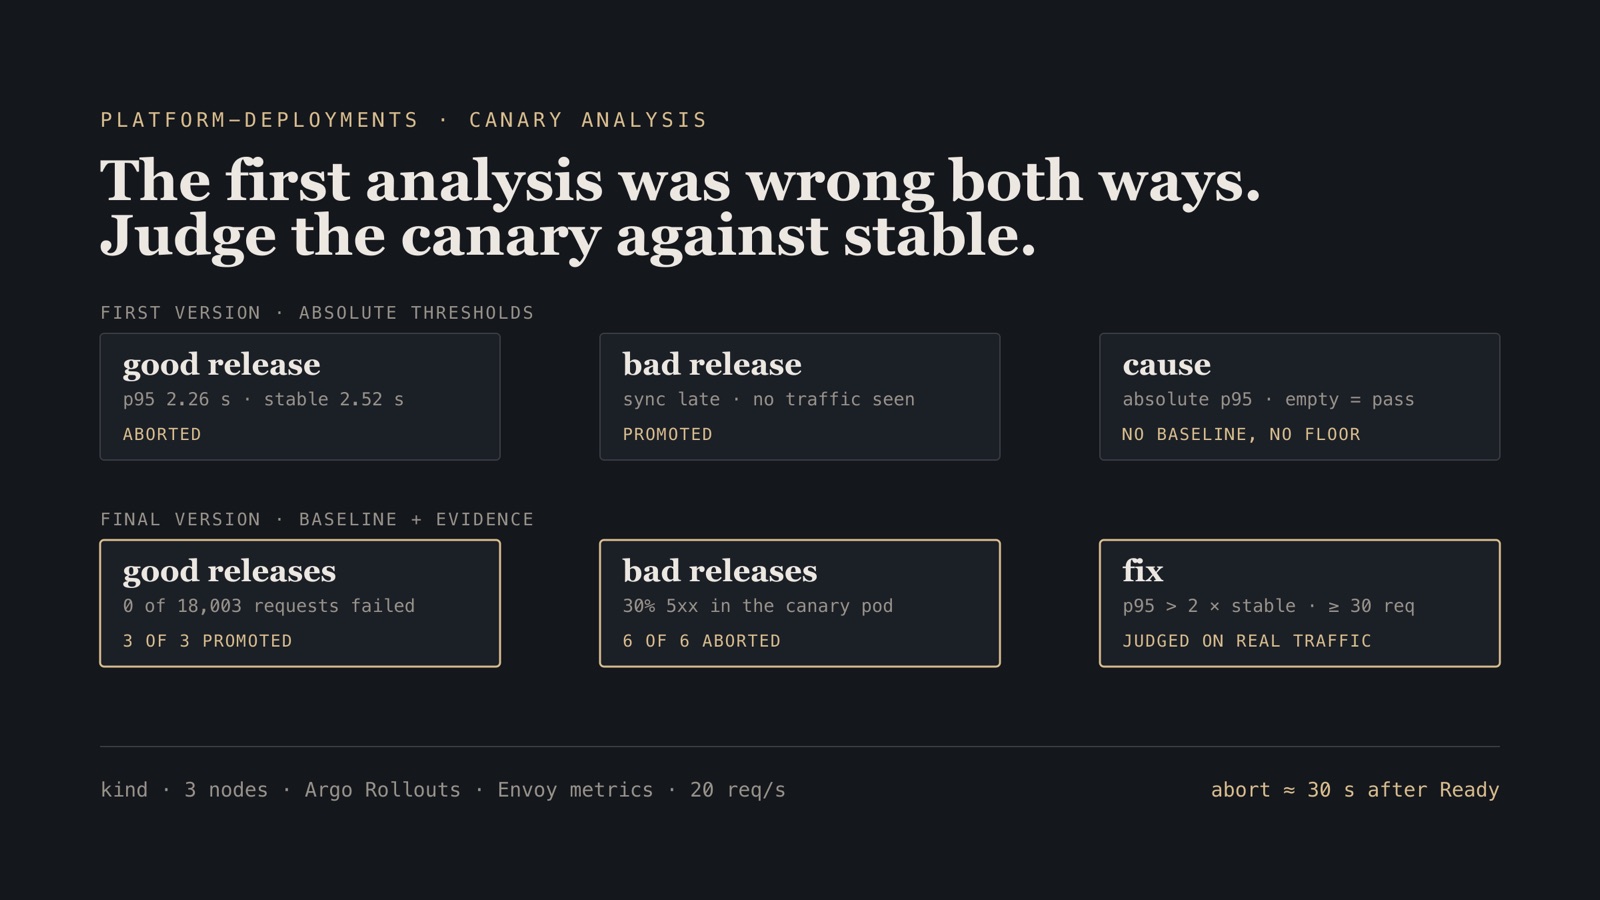
- 6 of 6 bad releases aborted by canary analysis a release whose Envoy sidecar returns 500 on 30% of requests, under 20 req/s from k6; three runs with keep-alive clients, three with a new connection per request; Prometheus analysis every 15 s after a 30 s initial delay · measured Oct 2026 · kind, three nodes
- 0 of 18,003 requests failed across three good canary releases k6 at 20 req/s for five minutes per run, GET /healthz and GET /review-queue with a 10 s timeout; canary 20% → 50% with 60 s pauses, background analysis and an evidence step before 100% · measured Oct 2026 · kind, three nodes
- 1.7–10.9% of keep-alive requests reached a 20%-weight canary requests counted by the x-release response header while the canary pod was Ready; five api replicas and no traffic router, so a 20% weight is one pod in five · measured Oct 2026 · kind, three nodes
- 12 min 24 s from no cluster to eleven healthy Argo CD Applications median of three runs: kind create, image load, Argo CD by Helm, then the root Application until every Application is Synced and Healthy; every upstream image pulled again onto new nodes · measured Oct 2026 · kind, three nodes
- Commit in-cluster Git · Helm values A release is a commit to one values file; that file can also switch fault injection on.
- Sync Argo CD · sync waves About 15 s from commit to new ReplicaSet; one host stall delayed a sync by 226 s.
- Admit Kyverno · Pod Security Admission 6 of 6 violating manifests rejected; a Kyverno outage blocks only the app namespace.
- Canary Argo Rollouts · Envoy sidecar 20% is one pod in five; keep-alive clients sent it only 1.7–10.9% of their requests.
- Analyse Prometheus · AnalysisRun p95 judged against stable's; 6 of 6 bad releases aborted, median 30–31 s after Ready.
- Promote AnalysisTemplate No promotion below 30 canary requests in 3 min; a bad release once shipped on none.
Context
platform-deployments deploys governed-agent v0.1.0, unchanged, to a three-node Kubernetes cluster, and measures what happens when a release is good, when it is bad, and when a node goes away. The application was already written, which was the point: a platform should carry someone else’s software without asking it to change.
The question underneath it is an old one. A Deployment’s rolling update asks each new pod one thing, whether it is ready. A release that passes /healthz and then fails a third of real requests rolls out to every pod. The only signal that catches it is the traffic, so the release has to be judged on traffic, by something that is not a person watching a dashboard.
Constraints
Everything runs on kind: one control plane and two workers, each a container, all on one Docker VM with 8 vCPU and 11.7 GiB on an Apple M5. Node-to-node latency is therefore local, and a stall on the host stalls every node at once. That happened often enough that the measurements report which runs it visibly hit. The same 20 req/s on the same idle cluster gave a p95 of 25 ms in one minute and 542 ms in another.
No cloud account was used. The AWS version of the platform is Terraform for a VPC, EKS, RDS, ECR and KMS, validated, linted and scanned in CI, and never applied: a bill and an account to clean up, for a result nobody else could rerun.
Architecture
Argo CD installs the platform from one root Application in sync waves: the operators first (CloudNativePG, Argo Rollouts, Kyverno, a trimmed kube-prometheus-stack, metrics-server), then policies and tracing (Kyverno policies, the OpenTelemetry Collector, Jaeger), then a two-instance PostgreSQL cluster, then the application. A release is a commit to one file on a Git server inside the cluster, so measurement releases never reach the published history.
The api runs as five replicas of a Rollout with an Envoy sidecar in each pod. Envoy provides what the application does not: per-pod request counts and latency histograms for the analysis to query, a fault filter a release can switch on for its own pods, and an x-release header on every reply so the load generator can attribute each request to a release. The namespace is held to Pod Security Admission restricted plus four Kyverno policies in Enforce mode, with default-deny ingress.
In the code
The queries decide pass or fail; this wiring decides which pods they judge and when promotion is allowed. Background analysis starts at the first pause with the canary’s pod-template hash, which is how every query tells canary pods from stable ones, and the evidence check is appended in the template after the configurable steps, so a release commit can change the weights and pauses but cannot drop the step that refuses to promote on no traffic.
  strategy:
    canary:
      # No traffic router: the split is by replica count through one Service, so with
      # five replicas 20% is exactly one canary pod.
      canaryMetadata: {labels: {role: canary}}
      stableMetadata: {labels: {role: stable}}
      analysis:
        templates:
          - templateName: {{ include "ga.fullname" . }}-api-health
        startingStep: 1
        args:
          - name: canary-hash
            valueFrom: {podTemplateHashValue: Latest}
      steps: {{- toYaml .Values.api.canary.steps | nindent 8 }}
        - analysis:
            templates:
              - templateName: {{ include "ga.fullname" . }}-api-evidence
            args:
              - name: canary-hash
                valueFrom: {podTemplateHashValue: Latest}
The full Rollout, with the probes and the Envoy sidecar, is in charts/governed-agent/templates/rollout-api.yaml.
Decisions and trade-offs
| Decision | Alternative considered | Why | What it cost |
|---|---|---|---|
| Argo CD, one root Application, sync waves | Flux | One Application says whether the whole platform is up, and a paused or aborted Rollout shows in the same place | Waves are looser than they look: the database wave began 6 s into the previous one, before it was Healthy, for reasons still unexplained |
| Argo Rollouts canary on Prometheus analysis | A Deployment’s rolling update | Readiness cannot see a release that fails real requests | 30 s of exposure on every bad release while evidence accumulates |
| Canary p95 judged against stable’s | An absolute threshold | An absolute threshold aborted a good release during a host stall | If no stable pods serve traffic, the ratio passes and only the error check remains |
| No promotion without 30 canary requests | Trusting checks that pass on no data | A bad release that saw no traffic was promoted | No traffic, no release: quiet-period changes need synthetic load or a signed manual promotion |
| Envoy sidecar | Instrumenting the application | Metrics, fault injection and attribution without touching governed-agent | A second process per pod, and its timeouts became part of the application’s behaviour |
| Kyverno, scoped by namespace label | OPA Gatekeeper | Four rules that need no Rego, each with a unit test | Cluster-wide, failing-closed webhooks once blocked pod creation everywhere |
| Static Terraform for AWS | Applying it | A result anyone can rerun at no cost | All that is known about it is that it validates |
Results
Bad releases stop themselves. A release whose sidecar returns 500 on 30% of requests was aborted in 6 of 6 runs, a median of 30–31 s after the bad pod became Ready. The detection time is almost exactly the analysis’s 30 s initial delay: in five of six runs the first measurement already saw a 5xx rate of 0.24–0.31. Each run, 11–39 of about 4,800 requests failed because of the bad release.
Good releases ship clean. Three good releases promoted under 20 req/s with no failed request among 18,003 and a p95 of 21–24 ms. Promotion took about 135 s from the new ReplicaSet, 120 s of it the canary’s two pauses.
Weight is not exposure. Without a traffic router, 20% is one pod in five. Clients opening a connection per request sent it 12.0–13.4% of their requests; keep-alive clients sent it 1.7–10.9%, because a kept-alive connection stays where it started.
The rest of the platform. Draining a worker under load took 31–39 s with the PodDisruptionBudget holding three api pods; two runs failed nothing, and the third failed 28 of 4,663 requests (0.6%) when every pod landed on the remaining worker of a busy host. Kyverno rejected 6 of 6 violating manifests, a Deployment among them, and kyverno test passes 22 of 22 in CI. A call from the default namespace to the api times out; from the load namespace it answers. A cold start from no cluster to eleven healthy Applications took a median of 12 min 24 s, mostly image pulls. At rest the platform uses about 0.8 CPU and 5.5 GiB across 38 pods.
The analysis itself, and the two ways it was wrong before it was right, is the subject of My canary analysis aborted a good release and promoted a bad one.
What went wrong
The platform did not hold up the first time. The measurement runs found fifteen problems, each fixed in its own commit and listed in MEASUREMENTS.md. Three of them changed how I would build any cluster.
A crash-looping admission controller blocked recovery. The first good release under load cascaded: 1 s probe timeouts restarted Kyverno, metrics-server, the Prometheus operator and Argo CD’s repo server; each restart made the API server busier; and Kyverno’s webhooks, cluster-wide and failing closed, blocked pod creation in every namespace while it was down, including for the operators trying to recover. The webhooks now cover only the namespaces the policies judge.
Service links overrode the application’s port. Every api pod crash-looped because Kubernetes injected GA_API_PORT=tcp://10.96.x.x:80 for a Service named ga-api, and the application read it as its port. enableServiceLinks: false is now on every pod.
A healthy database primary was restarted by its own probe. CloudNativePG’s liveness check also confirms that the primary can reach the API server, with a 1 s timeout. On a busy control plane that failed and Kubernetes restarted a primary that was fine.
Most of the fifteen share a shape: a slow API server leads to probe and lease timeouts, which lead to restarts that slow the API server further. A production cluster has more headroom, but probe timeouts sized for a busy node, webhooks scoped to what they judge, and analysis that compares with a baseline would each have mattered on a bad day anywhere.
What I’d do differently
Put a traffic router in from the start. Replica weighting made the canary’s real exposure depend on how clients reuse connections. A Gateway API plugin for Argo Rollouts would set the share per request and allow 1–5% steps.
Drain the primary’s node too. Every drain run used the worker without the PostgreSQL primary, whose node-local storage and disruption budget block eviction. Draining that node is a switchover first, and it is not automated or measured yet.
Apply the Terraform once. Static checks say the AWS version is well-formed, not that it works. A sandbox account and the same measurement scripts would turn it from a description into a result.
Connected systems
All case studiesgoverned-agent: an analytics agent that can propose but never execute
Author
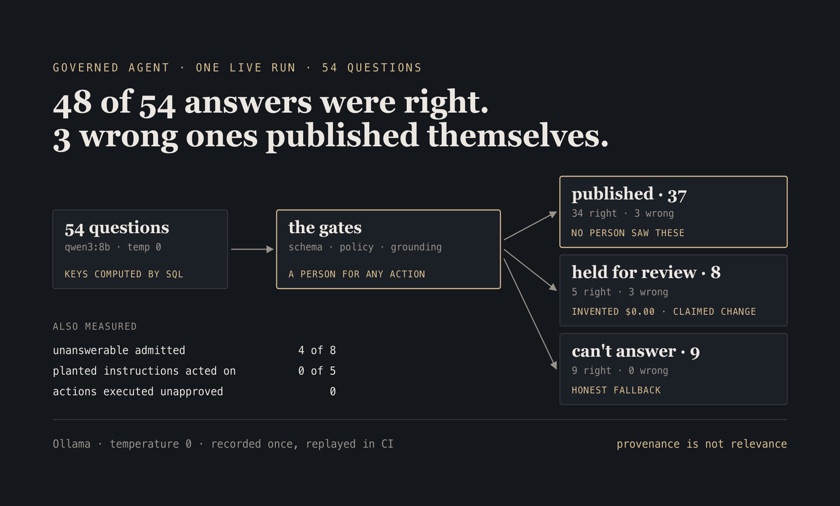
An agent that writes SQL and proposes refunds will sometimes be confidently wrong, and a system prompt is not a control
48/54 answers matched an answer key computed by SQLone live run of a 54-question golden set against qwen3:8b under Ollama, temperature 0, thinking off, over a seeded synthetic warehouse; 95% CI 78–95% · Oct 2026, one recorded run
3 of 37 answers published without review were wrongsame run; a finding is published only after its schema, policy and grounding checks pass with no proposal attached; 95% Wilson interval on 3/37 is 3–21% · Oct 2026, one recorded run
Python · LangGraph · MCP · sqlglot · DuckDB · FastAPI
Sharding Postgres with Citus, measured against TimescaleDB and ClickHouse
Author
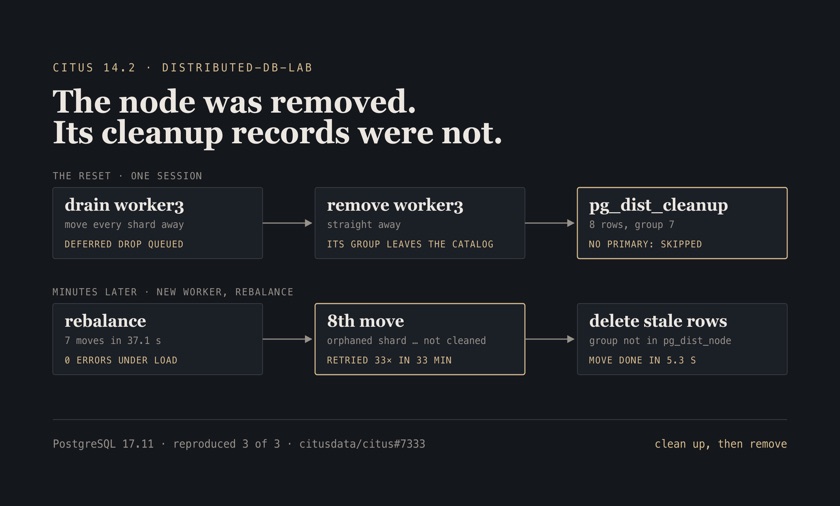
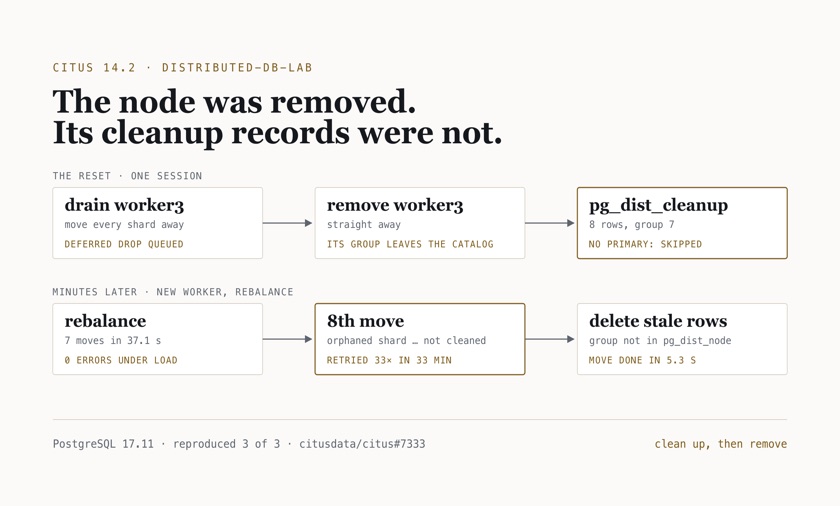
A schema that refused to distribute six ways, a tenant whose shard was 7.4× the median, and a rebalance under live writes
0 errors while a worker joined and 7 shard groups moved under load8 client threads for 600 s, 80% one-tenant reads and 20% single-row inserts against the Citus coordinator; every acknowledged write counted back afterwards · measured Oct 2026
4.2× faster join co-located than repartitionedthe same join over tenants 1–400, both returning 617,895 rows; p50 of 7 runs, 1,251.7 ms co-located on (tenant_id, user_id) vs 5,206.0 ms against a copy distributed by user_id · measured Oct 2026
Citus · PostgreSQL 17 · TimescaleDB · ClickHouse · ClickHouse Keeper · Docker Compose
streaming-platform: exactly-once clickstream, counted at every layer
Author
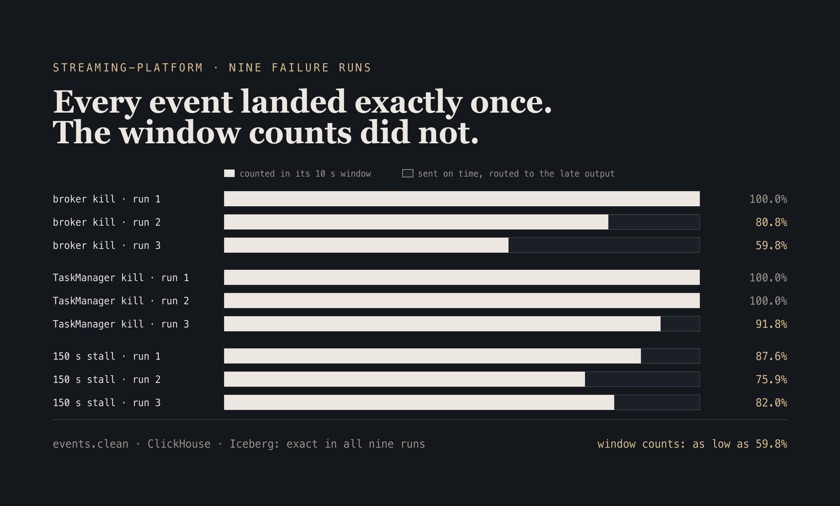
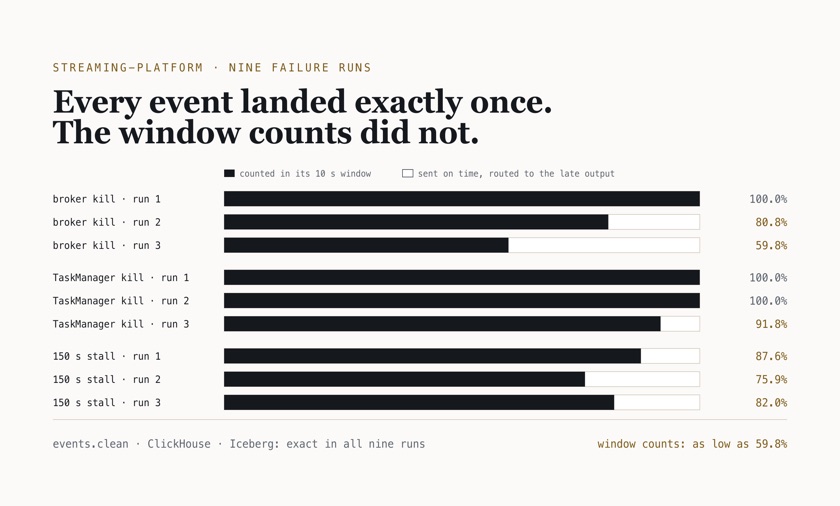
Exactly-once is a claim about counts, so every layer was counted against a ledger, through broker kills, TaskManager kills and stalls
9 of 9 failure runs with every event layer exactthree controller-broker kills, three TaskManager kills and three 150 s stalls under load; Kafka, ClickHouse, Iceberg and the dead-letter topic reconciled against the generator's ledger by sequence number · Oct 2026
59.8% of on-time events left in the window counts after one broker kill118,229 of 197,749 on-time events counted in their 10 s windows in the worst of three broker-kill runs; the rest went to the late side output because catch-up reordered partitions past the 5 s watermark bound · Oct 2026
Apache Kafka 4.3 · Apache Flink 1.20 · ClickHouse · Apache Iceberg · Schema Registry · Avro · Prometheus
Continue the conversation
See the full career record, or get in touch about a senior data, platform, or AI engineering role.