
What you'll build
A three-node MongoDB replica set on Docker that keeps accepting majority writes after you kill its primary, plus the host settings the other five engines in the series need.
- Time
- ~45 min hands-on
- Level
- Intermediate
- Tested on
- MongoDB 8.0 · ScyllaDB 2026.1 · SolrCloud 9 · MariaDB 11.8 + Galera 4 · Redis 8 · PostgreSQL 18 · Docker Compose v2 · 8 CPU / 12.5 GB
Before you start
- Docker 24+ with 8 CPU and 12.5 GB of RAM available to the daemon
- Docker Compose v2 — the `docker compose` subcommand, not `docker-compose`
- About 20 GB of free disk for images and volumes
- Comfort with a shell and at least one query language
On this page
- The claim I wanted to check
- Why these six engines
- Step 1 — Size the host
- Step 2 — Raise the AIO limit
- Step 3 — Bring up one stack: MongoDB, three nodes
- Step 4 — Stop the preferred primary
- Step 5 — Prove the write survived
- Step 6 — Clean up before the next stack
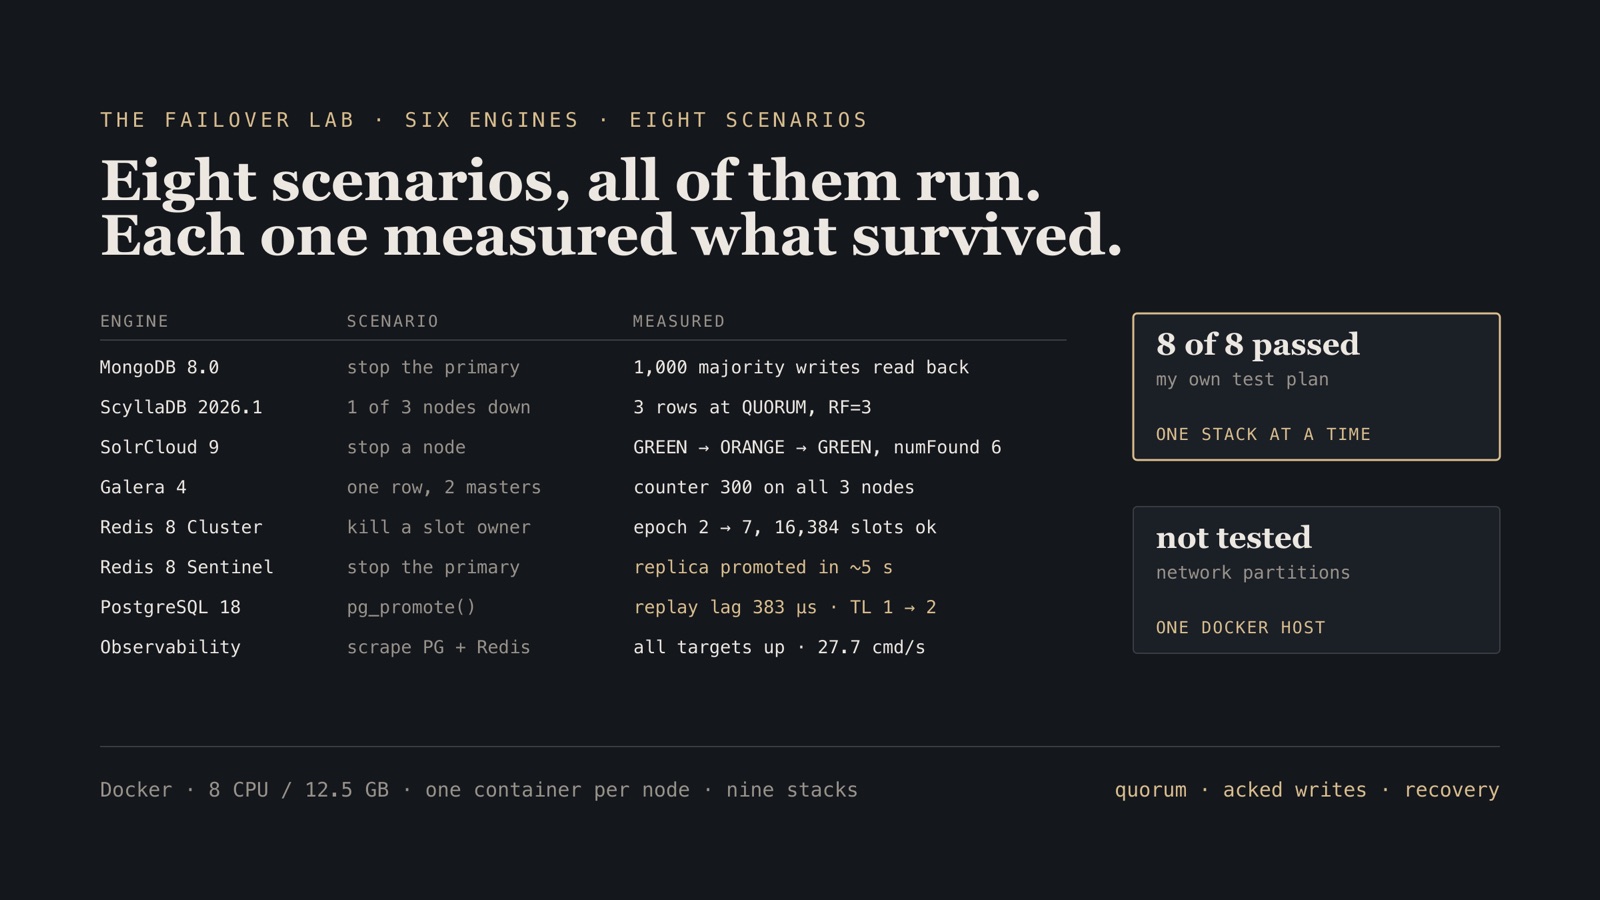
- The eight scenarios, and the results
- The numbers worth remembering
- The rest of the series
- Troubleshooting
The claim I wanted to check
Every high-availability document ends with the same sentence in a different typeface: the cluster tolerates the loss of a node. It almost never says which node, how long the gap is, whether the write you just acknowledged is still there afterwards, or what the survivors do about writes while an election runs.
So I wrote a test plan with eight scenarios and ran all of them on one machine, one stack at a time, inside a Docker daemon with 8 CPU and 12.5 GB of RAM. Every cluster was brought up, exercised, and torn down before the next one started, because 12.5 GB does not hold two of these at once.
8 of 8 scenarios passed — in my own test plan. That qualifier is the honest one. There is no external conformance suite behind this. I decided what “passed” meant for each engine, wrote it down, and then went and checked it. What follows is the rig, the plan, the numbers it produced, and one scenario run end to end so you can reproduce the method on the other seven.
The compose files are reproduced inline in this post and in the rest of the series, and every stack is in db-failover-lab to clone, one cluster at a time.
Why these six engines
Six engines, eight scenarios. Redis appears twice because it ships two entirely different failure models, and the last row is the observability stack that watches the others.
- MongoDB 8.0 — a leader-based replica set with RAFT-like elections. This is the “the driver handles it” model, and it is where
w: "majority"earns its keep. - ScyllaDB 2026.1 — leaderless, quorum per query, RF=3. Nothing gets promoted because nothing was ever a leader. The interesting failure here is not the node loss; it is the restore.
- SolrCloud 9 — ZooKeeper-coordinated shards and replicas. Its distinctive behavior is that “degraded” and “unavailable” are genuinely different states, and it will tell you which one you are in.
- MariaDB 11.8 + Galera 4 — virtually synchronous multi-master with certification-based conflict resolution. The only engine in the set where a graceful shutdown and an ungraceful kill of the same two nodes produce opposite cluster states.
- Redis 8 — Cluster (16,384 hash slots, per-shard failover) and Sentinel (one primary, quorum-based promotion). Two promises, two failure models, one product.
- PostgreSQL 18 — single primary, streaming replication, and a promotion that you or your orchestrator has to initiate. The one engine here that will not fail over on its own.
Step 1 — Size the host
Every stack in this series is deliberately shaped to fit an 8 CPU / 12.5 GB daemon with exactly one stack running. ScyllaDB nodes are pinned to one shard and 1200 MB each; the Galera nodes and the six Redis nodes are similarly small. If Docker has less than this, containers will start and then be OOM-killed halfway through a bootstrap, which looks exactly like a cluster bug and is not one.
On Docker Desktop this lives in Settings → Resources. Set CPUs to 8 and memory to 12.5 GB, then apply and restart.
Verify.
$ docker info | grep -E "^ CPUs|^ Total Memory"
 CPUs: 8
 Total Memory: 12.5GiB
If Total Memory reads lower than that, the daemon did not pick up the change — apply and restart it again before continuing.
Step 2 — Raise the AIO limit
ScyllaDB’s Seastar runtime allocates asynchronous I/O contexts per reactor at startup. The Linux VM behind Docker Desktop ships with a conservative fs.aio-max-nr, and it is a kernel-wide limit, so the first two Scylla nodes started fine and the third one died with:
system does not satisfy minimum AIO requirements
The limit belongs to the VM, not to any one container, so you raise it from a privileged throwaway container.
docker run --rm --privileged alpine sysctl -w fs.aio-max-nr=1048576
Verify.
$ docker run --rm --privileged alpine sysctl -w fs.aio-max-nr=1048576
fs.aio-max-nr = 1048576
Gotcha. This setting lives inside the Docker VM, not on your machine. Restarting Docker Desktop resets it, and the symptom comes back looking like a fresh problem. If a Scylla node refuses to start on a day when it worked yesterday, re-run the privileged container before you debug anything else.
Step 3 — Bring up one stack: MongoDB, three nodes
Three mongod processes, one replica set, no authentication. Auth is skipped deliberately: the keyfile and RBAC setup is a separate exercise, and mixing it into a failover test means every failure has two possible causes.
name: mongo-ha

services:
  mongo1:
    image: mongo:8.0
    command: ["mongod", "--replSet", "rs0", "--bind_ip_all", "--port", "27017"]
    ports: ["27021:27017"]
    volumes: ["m1:/data/db"]
  mongo2:
    image: mongo:8.0
    command: ["mongod", "--replSet", "rs0", "--bind_ip_all", "--port", "27017"]
    ports: ["27022:27017"]
    volumes: ["m2:/data/db"]
  mongo3:
    image: mongo:8.0
    command: ["mongod", "--replSet", "rs0", "--bind_ip_all", "--port", "27017"]
    ports: ["27023:27017"]
    volumes: ["m3:/data/db"]

volumes:
  m1:
  m2:
  m3:
docker compose -f mongo-ha/docker-compose.yml up -d
Then initiate the set. mongo1 gets priority 2 so that the set has a preferred primary — that is what makes the failback at the end of Step 5 observable rather than random.
docker exec mongo-ha-mongo1-1 mongosh --quiet --eval '
rs.initiate({
  _id: "rs0",
  members: [
    { _id: 0, host: "mongo1:27017", priority: 2 },
    { _id: 1, host: "mongo2:27017", priority: 1 },
    { _id: 2, host: "mongo3:27017", priority: 1 }
  ]
})'
I use a three-line status helper throughout, because rs.status() in full is several hundred lines and the three fields that matter are name, state and health.
docker exec mongo-ha-mongo1-1 mongosh --quiet --eval '
const s = rs.status();
print("set: " + s.set);
s.members.forEach(m => print("  " + m.name + "  " + m.stateStr + "  health=" + m.health));'
Verify. Within about ten seconds of rs.initiate():
set: rs0
  mongo1:27017  PRIMARY    health=1
  mongo2:27017  SECONDARY  health=1
  mongo3:27017  SECONDARY  health=1
If all three read SECONDARY, the election has not finished — wait and run it again. If one reads STARTUP, that member never got the config; check that the hostnames in rs.initiate() match the compose service names.
Step 4 — Stop the preferred primary
This first pass uses a controlled loss, not a crash: docker stop sends SIGTERM and lets mongod shut down cleanly. That isolates election behavior from recovery after an unclean process exit. A separate crash test would use docker kill --signal=KILL and should be recorded as a different scenario. The distinction matters enormously for Galera; for this MongoDB election, both paths should leave the same two-member majority able to elect.
docker stop mongo-ha-mongo1-1
Verify. Re-run the status helper against a surviving member:
set: rs0
  mongo1:27017  (not reachable/healthy)  health=0
  mongo2:27017  PRIMARY                  health=1
  mongo3:27017  SECONDARY                health=1
mongo2 and mongo3 are two of three members, which is a majority, so they can hold an election and elect one of themselves. If you had killed two of three, you would see all survivors sitting at SECONDARY forever, refusing writes — that is the correct behavior, not a hang.
Gotcha. The election is not instantaneous, and during it there is no primary. A client that treats a connection error as fatal will surface a failure to the user even though the set recovers on its own moments later. This is why retryable writes and a full replica-set connection string exist. Testing failover against a single-host URI tests nothing.
Step 5 — Prove the write survived
A failover that loses acknowledged writes is not a failover, it is data loss with good manners. w: "majority" is the setting that makes the promise: the write is acknowledged only once a majority of members have it, so any node that can win a subsequent election already has it.
docker exec mongo-ha-mongo2-1 mongosh --quiet --eval '
db.getSiblingDB("poc").orders.insertOne(
  { n: 1 },
  { writeConcern: { w: "majority", j: true } }
);
print("write after failover: OK");'
Verify.
write after failover: OK
On the full run I did the same thing at volume — 1000 documents written with w: "majority", j: true, then read back from a secondary, which returned 1000 documents replicated. The single insert above is the fast version of the same check.
Now bring the old primary back:
docker start mongo-ha-mongo1-1
Verify. It rejoins as a secondary, catches up from the oplog, and then reclaims the primary role because its priority is 2:
set: rs0
  mongo1:27017  PRIMARY    health=1
  mongo2:27017  SECONDARY  health=1
  mongo3:27017  SECONDARY  health=1
That failback is a second election, with a second window where there is no primary. Priorities are useful for keeping a preferred node in front of traffic; they are not free.
Step 6 — Clean up before the next stack
This is the step that keeps the rig usable. down without -v leaves the volumes behind, and nine stacks of orphaned volumes is a lot of disk.
docker compose -f mongo-ha/docker-compose.yml down -v
Verify.
$ docker volume ls --filter name=mongo-ha
DRIVER    VOLUME NAME
An empty listing under the header is what you want. To clear the whole series in one go:
for d in mongo-ha mongo-shard scylla-ha solr-ha galera-ha redis-cluster \
         redis-sentinel pg-replication observability; do
  docker compose -f $d/docker-compose.yml down -v 2>/dev/null
done
The eight scenarios, and the results
| Engine | HA / cluster | Sharding | Backup / restore | Monitoring | Result |
|---|---|---|---|---|---|
| MongoDB 8.0 | 3-node replica set, auto-failover | hashed-key sharded cluster (2 shards) | mongodump / mongorestore |
serverStatus, repl lag, oplog | PASS |
| ScyllaDB 2026.1 | 3-node, RF=3, QUORUM survives node loss | token ring, 256 vnodes/node | nodetool snapshot + refresh |
nodetool info / tablestats, :9180 |
PASS |
| SolrCloud 9 | ZK + 2 nodes, 2×2 shards/replicas | numShards=2 |
collection BACKUP / RESTORE | metrics API, solr-exporter | PASS |
| MariaDB 11.8 + Galera 4 | 3-node multi-master, quorum, IST rejoin | n/a (full replicas) | mariabackup SST | wsrep_* status vars |
PASS |
| Redis 8 Cluster | 3 primaries + 3 replicas, auto-failover | 16,384 hash slots, hash tags | AOF per node | CLUSTER INFO / SHARDS |
PASS |
| Redis 8 Sentinel | 1 primary + 2 replicas + 3 sentinels | n/a | AOF / RDB | SENTINEL master / replicas |
PASS |
| PostgreSQL 18 | primary + hot standby, pg_promote() failover |
n/a | pg_basebackup + WAL / PITR |
pg_stat_replication, lag |
PASS |
| Observability | exporters → Prometheus → Grafana | n/a | n/a | golden-signals dashboard | PASS |
Four columns per engine, because “does it fail over” is only a quarter of the question. A cluster that survives a node loss but cannot be restored from a backup is not highly available, it is briefly lucky.
The numbers worth remembering
These are the measurements, not the marketing. All of them came off this rig.
PostgreSQL 18 streaming replication reported write_lag ≈ 104 µs and replay_lag ≈ 383 µs in pg_stat_replication, with replica lag of 0 bytes and the slot showing active=t, wal_status=reserved. pg_promote() returned t, pg_is_in_recovery() flipped to f, and the timeline went from 1 to 2. Sub-millisecond replay on a single host is not a WAN number: it is a floor for this configuration, not a prediction of lag under load.
Redis Sentinel promoted a replica in ~5 s with quorum 2 and down-after-milliseconds 5000, and demoted the old primary to a replica of the new one when it came back. Redis Cluster promoted a replica after I killed a master owning slots 5461–10922, bumped the config epoch from 2 to 7, returned to cluster_state:ok with cluster_slots_ok:16384, and lost nothing.
MongoDB sharding on a hashed userId split 100,000 documents 49,607 / 50,393 across two shards. A query carrying the shard key touched 1 shard; a filter on a non-key field scatter-gathered to 2.
Galera took 150 concurrent updates of a single row from two masters at once. Node 2 logged 3 certification failures, node 3 logged 5 certification failures and 2 brute-force aborts, and the counter still converged to 300 on all three nodes. Optimistic concurrency caught every conflict at commit time and the arithmetic came out right.
SolrCloud went from GREEN to ORANGE when I stopped a node — 4 active replicas, 2 down — and kept answering *:* with numFound 6 the whole time, then recovered to GREEN on its own when the node came back.
ScyllaDB returned 3 rows at CONSISTENCY QUORUM with one of three nodes stopped, exactly as RF=3 promises.
The observability stack scraped a Postgres exporter and a Redis exporter into Prometheus with all targets up, and reported rate(redis_commands_processed_total[1m]) of 27.7 and a 500/500 hit/miss split — a 50% cache hit ratio — through to an auto-provisioned Grafana dashboard.
The rest of the series
Two of the eight are written up in full, and both are the write-ups I went looking for and could not find while I was stuck:
- nodetool refresh only reads the live table’s upload/ directory — the ScyllaDB behaviors that make a valid restore look empty, the restore that works after a TRUNCATE, and a correction to my first version of it.
- PostgreSQL 18 won’t take a volume at /var/lib/postgresql/data — the mount-point change that breaks every compose file copied from a PG 12–17 guide, then streaming replication, promotion and PITR on top of the corrected one.
Queued from the same lab notes: Galera’s graceful-versus-ungraceful quorum behavior; Redis Cluster against Sentinel with the timings side by side; SolrCloud’s ORANGE state and the solr.allowPaths backup failure; and the MongoDB shard-key explain plan. They will appear under /writing/ as they are finished.
Troubleshooting
| Symptom | Cause | Fix |
|---|---|---|
| Containers start, then get OOM-killed mid-bootstrap | Two stacks running at once, or the daemon has less than 12.5 GB | Tear the previous stack down with docker compose down -v first; run exactly one stack at a time |
A ScyllaDB node exits with system does not satisfy minimum AIO requirements |
fs.aio-max-nr in the Docker VM is too low for the number of reactors |
docker run --rm --privileged alpine sysctl -w fs.aio-max-nr=1048576, then restart the node |
| That AIO fix stops working after a restart | The sysctl lives in the Docker VM, which is recreated on restart | Re-run the privileged sysctl container after every Docker Desktop restart |
rs.initiate() fails with “already initialized” |
A volume survived an earlier run | docker compose -f mongo-ha/docker-compose.yml down -v, then bring it up again |
All members sit at SECONDARY and writes are refused |
No majority is reachable — two of three members are down | Restart a member; a three-node set needs two to elect |
not primary errors on a write after a failover |
The client is pinned to one host instead of the set | Use a full replica-set connection string and enable retryable writes |
| Disk keeps growing between labs | docker compose down without -v keeps named volumes |
Always down -v; then docker volume prune |
| A joiner never leaves the joining state | Every node was started at once, before the seed was ready | Start the seed, wait until it reports healthy, then start the joiners |